
Image Analysis and Quantitation
Analyzing and quantifying your western blot images.
On This Page | Blot Quantitation and Background | Volume Box Tools | Lane and Band Tools | Normalization | Molecular Weight Determination | Analysis Tips | Resources |
Sign Up for Western Blotting Tips and Webinar Alerts
Blot Quantitation and Background
What Does Quantitation Mean?
Quantitating a western blot refers to the measurement of the signal emitted by your protein band(s) of interest. The signal intensity of the band is directly proportional to the concentration of your target protein. By analyzing the intensity of the signal, you may determine whether the expression of the target protein in one sample has increased or decreased relative to another sample or control. Note: western blots are semi-quantitative so they are ideal for showing relative protein expression rather than an absolute quantity.
Band Volume
A protein band is a feature that appears in a western blot image. A western blot image is made up of pixels, which contain information about how much signal was collected at each location in the image. A digital image of a blot can be thought of as data in three dimensions. Each pixel in a blot image has an x and y coordinate, in addition to an intensity value, which occupies the third dimension. Therefore, band quantity can be thought of as a volume, which is the total amount of signal for all the pixels within that band.
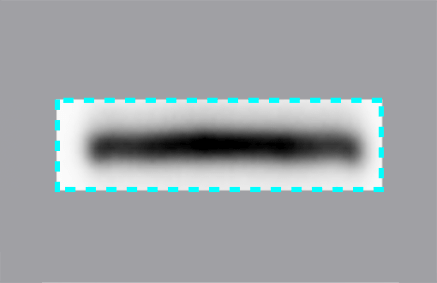
The pixels that comprise the part of a band have x and y coordinates, so outline an area. Each pixel also carries signal intensity information, which can be thought of as data in the third dimension.
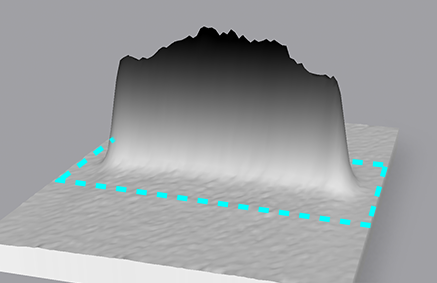
Therefore, band quantity is often referred to as band "volume" by imaging software.
Blot Background
No western blot is perfect, and all blot images show some level of background. This background can come from non-specific binding during antibody incubation, membrane background in the case of fluorescent images, or background arising from the instrumentation itself.
For bright, isolated bands on smooth backgrounds, this process can be relatively straightforward. For situations where the background intensity is near that of the signal, or where the background is uneven, identifying which pixels belong to the band of interest, and identifying the relevant background to subtract can be challenging. Image analysis software typically offer tools to subtract background, depending on the method of band quantification used.

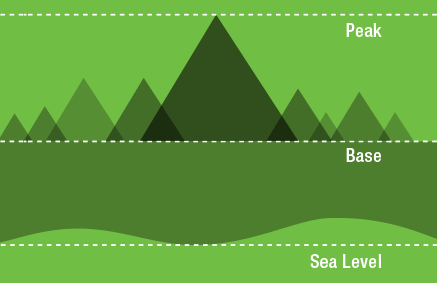
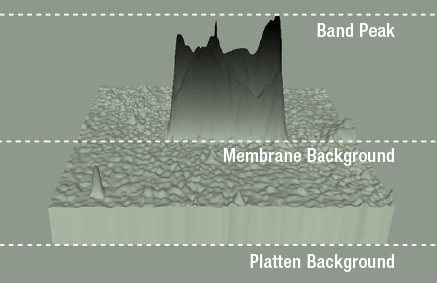
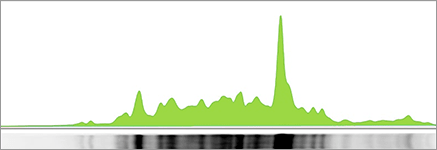
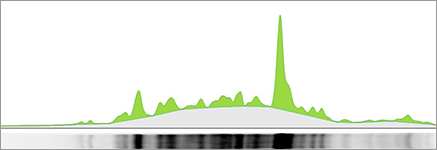
An intuitive way to think about background is to think about how we measure the size of mountains. Mountain height can be thought of in terms of their height above sea level, but if you want to climb a mountain, you are really interested in how tall the mountain is from its base.
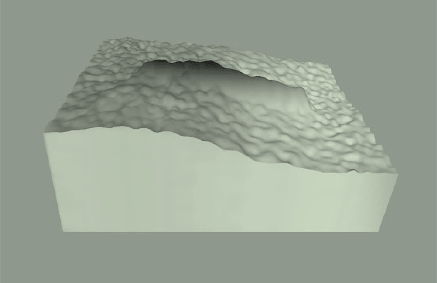
With western blot bands, the "base" is the area where the band meets the membrane background. Membrane background is typically above the platten background because most experiments will have at least some intrinsic signal like autofluorescence. Calculating the band volume requires adding up all of the signal included in the band and subtracting signal contributed from the intrinsic background.
When the intensity of the background of the blot is near the intensity of the band of interest, or when the background is not uniform, isolating the signal away from background becomes more challenging.
Background on the blot or image can interfere with accurate quantitation of band signal and may prevent you from measuring the relative expression of your target protein. Image analysis software typically contain tools to help you reduce the impact of background on a band’s quantity and allow you to better quantify the target protein’s true signal. Note: If you have not selected your preferred background subtraction settings, then your software will automatically use default settings, which may or may not be optimal for your analysis.
Western Blot Image Analysis: Volume Box Tools
One of the most intuitive ways to quantify a band is to simply draw a box around it and quantify the signal within the box. Volume boxes should be drawn around the bands of interest in such a way that they include all of the intensity of the band with a minimal amount of surrounding background.
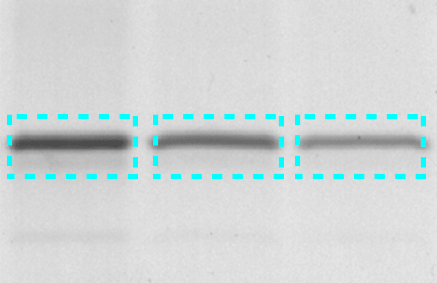
When using volume box tools, make sure to capture all of the band of interest without excessive background areas and without including adjacent bands.
Volume Box Tools: Background Subtraction
When using volume box analysis there are two common methods of subtracting background. The first is referred to as local background subtraction. In local background subtraction, the pixels immediately bordering the region of interest are averaged to establish the mean level of the background for the band of interest. Thus, each volume box has unique localized calculated level of background that is subtracted from it.
This method allows more customizable background subtraction, but it assumes that the background signal on the blot is additive with the signal from the band of interest. When comparing multiple bands that represent the same amount of protein, if one of the bands lies directly over a region with high background, then that specific band will result in a higher signal.
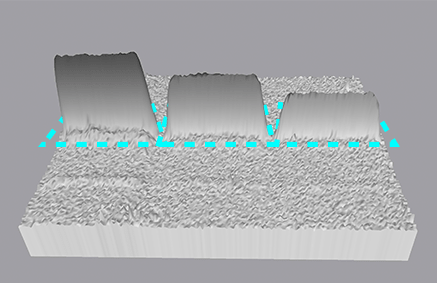
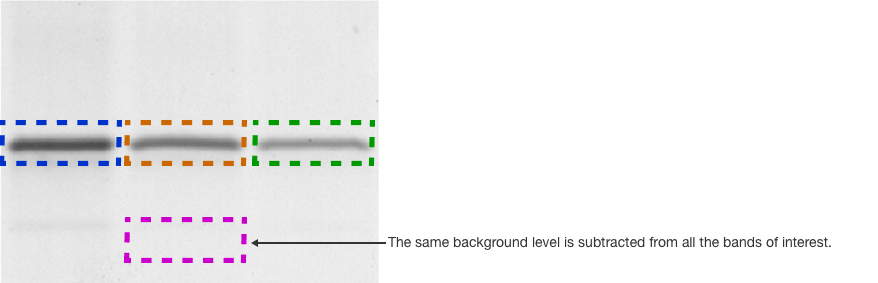
Another common method to subtract background is termed global background subtraction. In this method, you draw an additional region of interest and designate it as a background region that applies to the entire image. The mean value in this background volume box is then subtracted from all of the volume boxes, even if the background levels immediately surrounding the volume boxes vary.
Imaging software will typically report both the background subtracted volumes (called adjusted volumes) as well as the non-background subtracted volumes (simply called volumes).
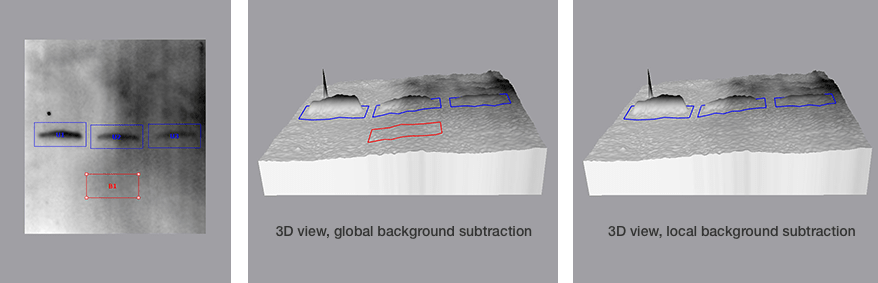
Comparison of Global and Local Background Subtraction
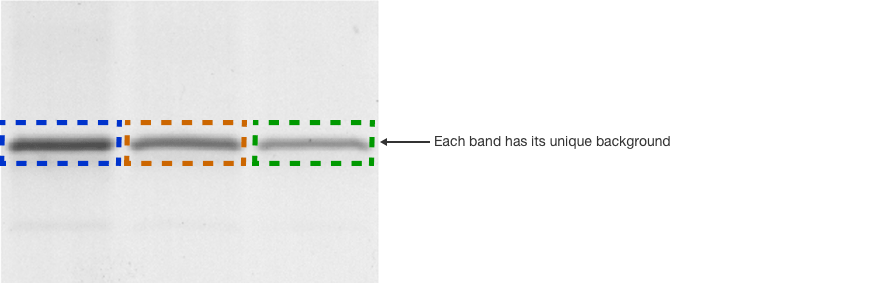
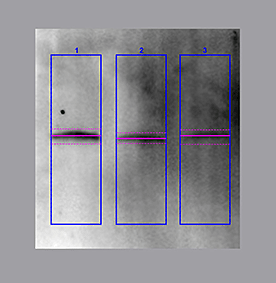
A different background level is subtracted from each volume box. The pixels immediately bordering the outside of the volume box are averaged to establish the mean level of the background for that band of interest. Thus, each volume box has its own unique calculated level of background that is subtracted from it. This method is particularly useful when different bands are on areas of different background.
For this blot, global background subtraction is difficult because each band is sitting on a very different background environment and local subtraction would be a better choice.
For this blot, global background subtraction is difficult because each band is sitting on a very different background environment and local subtraction would be a better choice.
Western Blot Image Analysis: Lane and Band Tools
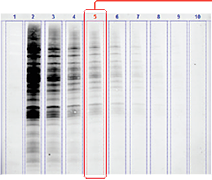
The other common approach for quantitating western blots is commonly referred to as using lane and band tools. This approach utilizes a two-step procedure where each lane of a blot is identified in the image, and then individual bands are identified inside each lane.
The lane and band tools are particularly useful when you want to quantitate either the total protein signal in each lane or multiple bands in each lane. Lanes should be drawn around the entire region where bands are present and extend slightly outside the boundary to ensure that all protein signal in the lane is included. Once the lane frame is drawn, the lane profile can also be visualized. Additionally, lane and band tools use a different approach of background subtraction, one that makes it easy to apply a localized background subtraction to each band in a lane.
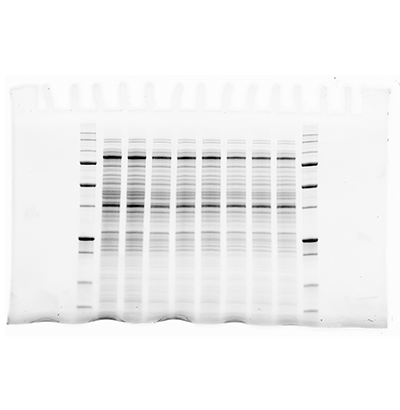
Overview of Lane and Band Workflow

The first step in using lane and band tools is to define the outlines of each lane on the blot.
Defining the lanes can be done automatically by the software, or by manually drawing lane frames and manually moving the lane outlines to follow the lanes on the blot.
If the lanes are not straight, or the gel has smiled or frowned, most software allows you to bend individual lane outlines to match the curve of the lane on the blot. Be careful to capture the entire lane, but avoid including neighboring lanes.

Next, the bands in each lane are identified. This can be as simple as clicking on the bands manually. Additionally, the software can detect bands automatically based on sensitivity settings set by the user. In either case, bands can be added, removed, or the boundaries of each band can be modified.
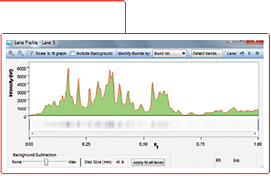
Most western blot image analysis software allows you to view a lane in profile, showing bands as peaks in a simulated electropherogram. The band boundaries can be precisely positioned in this view.
Lane and Band Tools: Background Subtraction
The final step in lane and band analysis is establishing the background to be subtracted. This is most easily visualized using the Lane Profile tool. In the Lane tool, background is typically determined using some variation of the rolling disc method.
In this method, it is helpful to imagine a disc of variable diameter (but always smaller than the largest blot feature) being “rolled” across the lane profile plot. The rolling disc will “fall up” the band peaks if the band peaks are wide enough and determine the background level. The disc size is adjustable, allowing more or less background to be removed. A small disc size fits further into band peaks and allows greater background subtraction. Conversely, large disc sizes will not fit very far into a band peak, reducing the amount of background subtracted.
This approach allows for a background subtraction that is based on the local background level and uses a single background subtraction setting that can be either applied to all lanes of a blot or to individual lanes.
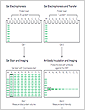
The area in green shows the signal left after background subtraction. Left: A large rolling disc leaves most of the area in the bands untouched as it cannot “fall up” into each peak. Right: A small rolling disc travels up into the peaks and subtracts more signal. To determine if the subtracted background signal is sufficient or too much, an sideways image of a lane is positioned adjacent to the chromatogram.
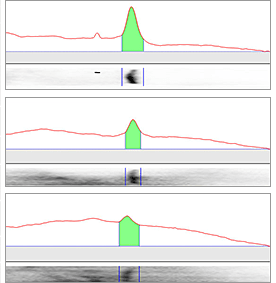
Large Rolling Disc
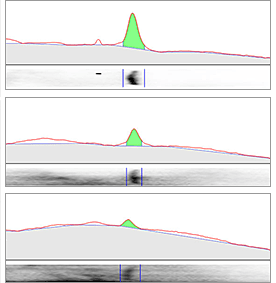
Small Rolling Disc
Using a large rolling ball (center) leaves a lot of the background in the band volume (green area). A small rolling ball (right) does a good job of removing membrane background and leaving just the true signal from the bands.
Tip
For the most accurate quantitation, choose a disc size that provides consistent background subtraction between lanes.
Western Blot Normalization
Why Normalize?
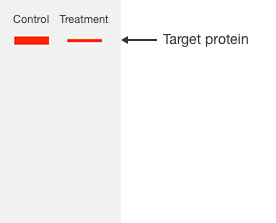
At first glance, a western blot result like this would seem to indicate that the treatment lowered target protein expression.
But, if the lanes were not loaded equivalently, this conclusion cannot be made unless the difference in sample load is accounted for. With normalization, the true up or down regulation of the target protein can be inferred.
In western blotting, normalization refers to correcting data to reduce the effects of experimental error arising from variations in pipetting, sample concentration, or uniformity of protein transfer between gel and membrane. Normalization allows your western blot to be more quantitative and gives you confidence that differences in signal on a western blot reflect differences in protein expression between samples on the blot.
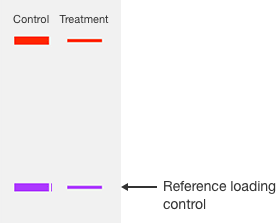
Normalizing western blot data relies on an internal loading control or normalization reference that is used to correct for these sources of experimental error.
There are two types of commonly used loading controls. The first control method is to use a protein that is present in all samples and its expression is not expected to be altered by the experimental treatment used in your experiment, often called a housekeeping protein. The second control method is to detect all proteins on the blot with a nonspecific agent to give the total protein signal.
In either case, any variation in the signal of the reference loading control indicates experimental variation rather than a difference in expression of the target protein. Regardless of which loading control is used, an effective normalization strategy requires two prerequisites to be met.
Accurate Normalization Requires:
- The signal of the target protein and the loading control ought to be in their linear range, not saturated. Increases in protein levels in the samples must be detectable as differences in signal intensity on a western blot
- The loading control must be unaffected by experimental perturbation. Misleading results will occur if an experimental treatment affects expression of the loading control
The Normalization Procedure
The correction underlying normalization is straightforward and some western blotting imaging software include tools to simplify the process. Whether you perform the process yourself, or rely on the software tools, the overall process is similar. A mathematical correction is used to compensate for sample-sample variability.
The first step is to quantify the background-subtracted protein signals for both the target protein as well as the loading control in each lane of the blot. Next, a reference lane is selected on the blot. This reference lane is usually the first sample lane or can be any other lane of your choice. Since the process of normalization is to essentially compensate for relative amounts of sample load, any lane can be selected as the reference. Then a normalization factor is determined by dividing the signal from the reference lane by the sample lanes to arrive at a normalization factor for each lane. This normalization factor is then applied to the protein of interest to the sample lanes by multiplying the signal from the protein of interest by the normalization factor.
Note: Some imaging software calculate the normalization factor by using the signal from the reference lane as the denominator. In this case, simply divide the signal from the protein of interest by the normalization factor.
Housekeeping Protein Controls
Housekeeping proteins are the most commonly used loading controls. These proteins are common to all samples in the experiment and are assumed to be unaffected by experimental conditions. Examples of commonly used housekeeping proteins include β-actin, GAPDH, and HPRT1 which are detected along with the protein of interest. Differences in the housekeeping protein signal indicate errors in loading the samples, non-uniform transfer, or other variabilities.
Normalization with Housekeeping Proteins

1
To perform normalization calculations, first quantify the signals from the protein of interest and the housekeeping protein for all lanes.

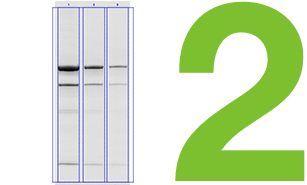
2
Then pick a lane to which you will use as the reference lane for the rest of the blot. Mathematically, any lane can be used as the reference, as the normalization factor will be applied to all other lanes as a ratio relative to the reference lane.

3
Then determine the normalization factor for each lane by deriving the ratio of the signals of the housekeeping protein in each lane, using the reference lane as the numerator. This ratio yields the difference in sample load between the reference and other lane.

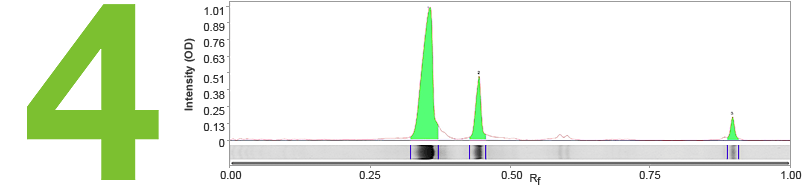
4
Then apply the normalization factor to the protein of interest to each lane by multiplying the protein signal by the normalization factor for that lane. This gives you the corrected or normalized signal for your protein of interest in the other lanes on the blot. Now the relative expression of the proteins can be accurately compared between the lanes.
Limitations of Housekeeping Proteins
Accurate normalization using housekeeping proteins requires both of the following:
- Signals are within their linear range
- Their expression does not vary due to experimental conditions
Use of housekeeping proteins are vulnerable to both of these limitations, and care must be taken to ensure accurate results.
Varying Levels of Housekeeping Proteins
The expression level of housekeeping proteins may change due to:
- Experimental conditions
- Developmental changes
- Post-transcriptional regulation
- Cell differences
- Tissue age and type
Using a housekeeping protein as a loading control requires that its expression remain constant across all samples of the experiment, and no change due to the experimental treatment. Published evidence shows several examples of differential expression of commonly used reference proteins (Ghosh R et al. 2014 and Eaton SL et al. 2013).
Therefore, before relying on a housekeeping protein as a loading control, validate that its expression is stable through the experiment and that it faithfully reflects the sample load.
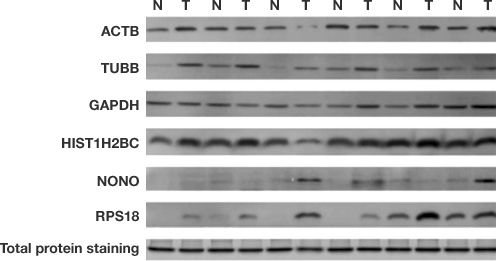
Differences in five candidate housekeeping proteins and total protein staining between tumor and non-cancerous tissues in the validation sample set. Immunodetection measurements of housekeeping protein levels show poor linearity and do not accurately indicate cell lysate loading levels. Total protein normalization of HKPs yields consistent band intensities. Hu X et al. (2016). Common housekeeping proteins are upregulated in colorectal adenocarcinoma and hepatocellular carcinoma, making the total protein a better "housekeeper."

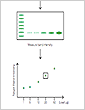
Linearity of tubulin, actin, and GAPDH in 0.5–4 μg of HeLa cell lysate. Note that the GAPDH signal is saturated and cannot be used for normalization.
Reliable normalization of target protein levels requires that the signals for both the target protein and the loading control are in their linear dynamic ranges. Unfortunately, housekeeping proteins are usually highly expressed, whereas target proteins are often expressed only in low abundance. Thus, to detect the target protein of interest, large amounts of cell lysate may need to be loaded, resulting in overloading of HKPs, yielding oversaturated reference bands, out of their linear range.
Total Protein as a Control
The use of total protein measurement for western blot loading controls (total protein normalization, TPN) is a method devised to minimize the inherent difficulties with using housekeeping proteins. Total protein levels can be determined by staining the membrane with total protein stains (e.g. SYPRO Ruby, Ponceau S, or Bio-Rad’s Stain-Free technology).
Because total protein stains are less sensitive than antibody-based immunodetection, they are far less likely to result in an oversaturated signal. As a result, they exhibit good linearity in the common loading range of 10–50 μg of cell lysate. Therefore, total protein normalization can be used successfully with most target proteins including those with low expression levels as both the target protein and the total protein signals will be within their respective linear ranges.
Since total protein normalization utilizes the entire protein load as the loading control signal, it is inherently less susceptible to expression variations of any one protein due to experimental conditions.
Stain-free imaging allows for total protein normalization.
Lane profiling of total protein signal helps remove background and refine band detection.
Advantages of Total Protein Normalization
- Total protein normalization is less susceptible to experimental perturbation, so more faithfully reflects sample load
- The linear dynamic range of most total protein stains better matches that of low expressing target proteins allowing for more accurate quantitation
Normalization with Total Protein Stains

1
In order to perform the normalization calculations, first quantify the signals from the protein of interest as well as the total protein signal in each lane. Software packages such as Image Lab Software contain tools for total protein normalization, simplifying this step.

2
Then pick a lane to which you will use as the reference lane for the rest of the blot. Mathematically, any lane can be used as the reference, as the normalization factor will be applied to all other lanes as a ratio relative to the reference lane.

3
Then determine the Normalization factor for each lane by deriving the ratio of the signals of the total protein in each lane, using the reference lane as the numerator. This ratio yields the difference in sample load between the reference and other lane.

4
Then apply the Normalization factor to the protein of interest to each lane by multiplying the protein signal by the Normalization factor for that lane. This gives you the corrected or normalized signal for your protein of interest in the other lanes on the blot. Now the relative expression of the proteins can be accurately compared between the lanes.
Molecular Weight Determination
Many blot analysis software packages allow you to estimate the molecular weight of your target protein. All that is required is that you include a molecular weight standard as one of the lanes on your blot and calculate a standard curve based on the known molecular weights of the proteins in the molecular weight standard.
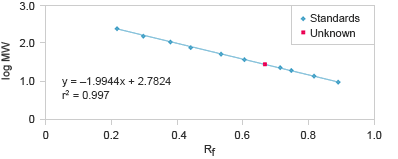
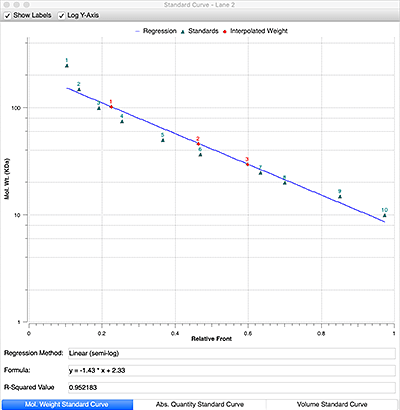
A linear relationship exists between the logarithm of the molecular weight of a protein and relative front, Rf (the Rf is the ratio of the distance migrated by the protein to the distance migrated by the dye front). Plotting of the log of the known weights of the molecular weight standard as a function of Rf, describes a line with known slope and intercept and allows the calculation of the molecular weights of an unknown protein.
Calculating Molecular Weight
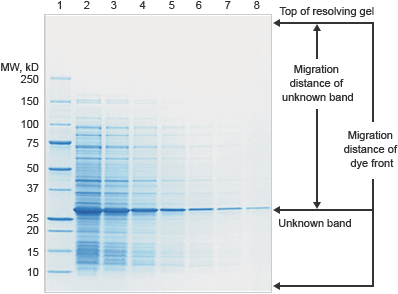
Molecular weight determination using SDS-PAGE gels takes advantage of the linear relationship between the logarithm of the molecular weight of a protein and relative front, Rf.
1
Measure the distance from the top of the resolving gel to each band of the standard and to the dye front.
2
Calculate the Rf (relative front) for each band in the standard:
Rf =
Distance to the band
Distance to the dye front
The resulting plot should give a line.
3
Calculate the Rf for the unknown band using the same formula
4
Plot the log (MW) as a function of Rf for the standards bands.
5
Generate the equation y = mx + b, and solve for y to determine the MW of the unknown protein.
Image analysis software typically contain tools that simplify the molecular weight calculations and only require you to identify what standard was loaded on the gel. You only then need to identify your bands of interest and set the location of the starting wells on the gel and location of the dye front.
Using Image Lab Software to Determine Molecular Weight
1
Most image analysis software contain tools for determining molecular weight. Here we use Image Lab Software as an example, but most software packages have similar tools.
The first step is to acquire the image of your blot. At least one standards lane should be included. For the most accurate results, it is best to load standards in both the first and last lanes.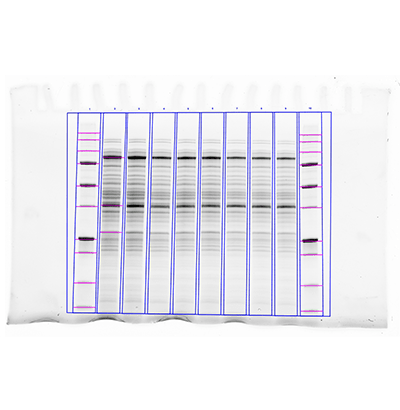
2
Define the lanes on the gel, making sure to set the top of the lanes to be either the bottom of the wells or the top of the resolving gel. Set the bottom of the lane frame at the dye front.
Detect bands in the standards and sample lanes.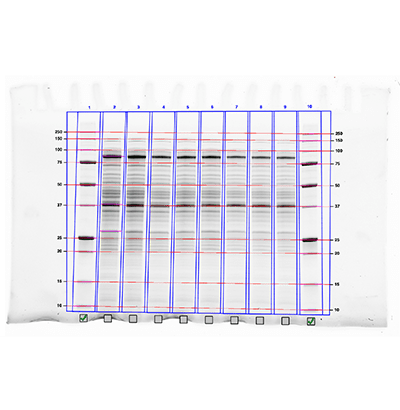
3
In the software, enter the type of standard used (or enter the molecular weight data for standards not listed in your software) and instruct the software which lanes are to be used as standard lanes.
4
The software will automatically plot the molecular weight as a function of Rf and interpolate the molecular weights of your proteins of interest.
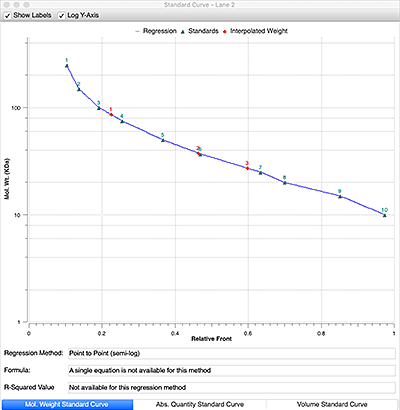
5
In Image Lab, other regression methods such as point-to-point can also be used. This may provide a better fit for gels with non-uniform acrylamide or gels with some bands in the stacking gel.
Western Blot Image Analysis Tips
- Optimize your western blots.
Faint bands or uneven background can make quantitative analysis challenging. The best practice to avoid these challenges is to optimize the upstream steps. Refer to previous sections of this guide to improve gel separation, clean up membrane background, and generate brighter target bands. - Validate your quantitation tools.
The best way to learn about your quantitation tools is to generate blots with known, titrated amounts of target protein. For example, run a blot where the lanes are loaded with 20 µg, 15 µg, and 10 µg of total protein. After analysis, the relative quantitation of the target bands should be 2, 1.5, and 1. Try different quantitation tools and settings until you can reliably reproduce the correct results. - Validate your loading control.
When using a housekeeping protein as a loading control for normalization, make sure its expression does not change due to the experimental conditions. If it does, then normalization will actually make your quantifying expression of your protein of interest less accurate. It is common to test multiple potential housekeeping proteins for a given experimental procedure.
Western Blotting Resources

Find the right products for you using the free Western Blot Selector Tool

Get Your Free Protein Standard Temporary Tattoo
You too can sport a Precision Plus Protein Kaleidoscope standard tatto temporarily.

Better Western Blotting Guide
Tips, Techniques, and Technologies from the Western Blotting Experts at Bio-Rad Laboratories

Western Blot University
Courses designed to make you a western blotting expert.
Learning Center

Western Blotting Protocol Library
Filter by your laboratory set-up and reagents to get a custom western blotting protocol that best fits your needs.

Total Protein Normalization
Compare changes in protein expression by establishing the baseline needed to correct against common errors such as inconsistent sample preparation, pipetting error, and uneven protein transfer.

Stain-Free Imaging Technology
Visualize proteins on gels and blots without staining and destaining steps, then use total protein normalization for quantitative western blots.

Fluorescent Western Blotting
Learn about advances in digital imaging and fluorescent western blotting that have resulted in overcoming common challenges in traditional western blotting.

Film vs. Digital Western Blot Imaging
Discover the advantages that digital imaging has over film.

Western Blot Doctor Troubleshooting Guide
Our self-help troubleshooting guide covers solutions to many common and not-so-common western blotting issues and helps your blots look their best.

Fundamentals of Western Blotting Course #5: Image Analysis
Documents

Protein Blotting Guide (PDF 7.2 MB)
Details on blotting technology, available products, and methods, plus tips, techniques, and troubleshooting.

Protein Electrophoresis Guide (PDF 8.5 MB)
A guide to polyacrylamide gel electrophoresis and protein detection, including theory, product selection, protocols, and more.
ChemiDoc MP System Brochure (PDF 1.5 MB)
Explore the features and benefits of the new high-end imaging system for the best fluorescence and chemiluminescence detection.
Stain-Free Approach to Western Blotting (PDF 864 KB)
Learn how to use stain-free technology for total protein normalization as an alternative to the standard blot normalization process.
Stain-Free Western Workflow Brochure (PDF 541 KB)
See how the Stain-Free Western Workflow compares to traditional western blotting workflows.
Determining the Appropriate Sample Load When Using a Stain-Free Western Workflow (67 KB)
Determine the correct sample load for the detection of target proteins before performing a western blot experiment.
Validating the Expression Consistency of a Housekeeping Protein (198 KB)
Discover how to validate the consistency of HKP expression before performing a western blot experiment.
Publications
A Defined Methodology for Reliable Quantification of Western Blot Data
Learn about the methodology to obtain reliable, quantitative data from chemiluminescent western blots using standardization procedures coupled with the updated reagents and detection methods.
The Design of a Quantitative Western Blot Experiment
Read a summary about a complete western blot workflow with a focus on sample preparation and data analysis for quantitative western blotting.
References
- Ghosh R, Gilda JE, Gomes AV. The necessity of and strategies for improving confidence in the accuracy of western blots. Expert Rev Proteomics. 2014 Oct;11(5):549-60. PMCID: PMC4791038
- Eaton SL et al. Total protein analysis as a reliable loading control for quantitative fluorescent Western blotting. PLoS One. 2013 Aug 30;8(8):e72457. PMCID: PMC3758299