Nucleic acid amplification and detection techniques are among the most valuable tools in biological research today. Scientists in all areas of life science — basic research, biotechnology, medicine, forensics, diagnostics, and more — utilize these methods in a wide range of applications. For some applications, qualitative nucleic acid detection is sufficient. Other applications, however, demand a quantitative analysis. Real-time PCR can be used for both qualitative and quantitative analysis; choosing the best method for your application requires a broad knowledge of this technology. This section provides an overview of real-time PCR, reverse-transcription quantitative PCR techniques, and the choice of instruments that Bio-Rad offers for these techniques. It also provides tips for steps in RNA isolation such as sample collection, RNA extraction, and analyzing the quality and quantity of RNA..
Page Contents
In conventional PCR, the amplified DNA product, or amplicon, is detected in an end-point analysis. In real-time PCR, the accumulation of amplification product is measured as the reaction progresses, in real time, with product quantification after each cycle.
The qPCR workflow below delineates the steps in real-time PCR. First, amplification reactions are set up with PCR reagents and unique or custom primers. Reactions are then run in real-time PCR instruments and the collected data is analyzed by proprietary instrument software.

Real-time detection of PCR products is enabled by the inclusion of a fluorescent reporter molecule in each reaction well that yields increased fluorescence with an increasing amount of product DNA. The fluorescence chemistries employed for this purpose include DNA-binding dyes and fluorescently labeled sequence-specific primers or probes. Specialized thermal cyclers equipped with fluorescence detection modules are used to monitor the fluorescence signal as amplification occurs. The measured fluorescence is proportional to the total amount of amplicon; the change in fluorescence over time is used to calculate the amount of amplicon produced in each cycle.
The main advantage of real-time PCR over PCR is that real-time PCR allows you to determine the initial number of copies of template DNA (the amplification target sequence) with accuracy and high sensitivity over a wide dynamic range. Real-time PCR results can either be qualitative (the presence or absence of a sequence) or quantitative (copy number). Quantitative real-time PCR is thus also known as qPCR analysis. In contrast, PCR is at best semiquantitative. Additionally, real-time qPCR data can be evaluated without gel electrophoresis, resulting in reduced bench time and increased throughput. Finally, because real-time qPCR reactions are run and data are evaluated in a unified, closed-tube qPCR system, opportunities for contamination are reduced and the need for postamplification manipulation is eliminated in qPCR analysis.
Real-time PCR/qPCR assays have become the tool of choice for the rapid and sensitive determination and quantitation of nucleic acid in various biological samples, with diverse applications such as gene expression analysis, the detection of genetically modified organisms in food, and cancer phenotyping.
In research laboratories, qPCR assays are widely used for the quantitative measurement of gene copy number (gene dosage) in transformed cell lines or the presence of mutant genes. In combination with reverse-transcription PCR (RT-PCR), qPCR assays can be used to precisely quantitate changes in gene expression, for example, an increase or decrease in expression in response to different environmental conditions or drug treatment, by measuring changes in cellular mRNA levels.
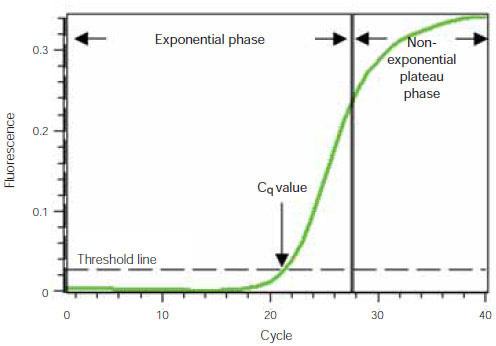
To understand how real-time PCR works, we illustrate a qPCR analysis using a typical amplification plot (Figure 1). In this plot, the number of PCR cycles is shown on the x-axis, and the fluorescence from the amplification reaction, which is proportional to the amount of amplified product in the tube, is shown on the y-axis.
The amplification plot shows two phases, an exponential phase followed by a non-exponential plateau phase. During the exponential phase, the amount of PCR product approximately doubles in each cycle. As the reaction proceeds, however, reaction components are consumed, and ultimately one or more of the components becomes limiting. At this point, the reaction slows and enters the plateau phase (cycles 28–40 in Figure 1).

Figure 1. Amplification plot. Baseline-subtracted fluorescence versus number of PCR cycles.
Initially, fluorescence remains at background levels, and increases in fluorescence are not detectable (cycles 1–18, Figure 1) even though product accumulates exponentially. Eventually, enough amplified product accumulates to yield a detectable fluorescence signal. The cycle number at which this occurs is called the quantification cycle, or Cq. Because the Cq value is measured in the exponential phase when reagents are not limited, real-time qPCR can be used to reliably and accurately calculate the initial amount of template present in the reaction based on the known exponential function describing the reaction progress.
The Cq of a reaction is determined mainly by the amount of template present at the start of the amplification reaction. If a large amount of template is present at the start of the reaction, relatively few amplification cycles will be required to accumulate enough product to give a fluorescence signal above background. Thus, the reaction will have a low, or early, Cq. In contrast, if a small amount of template is present at the start of the reaction, more amplification cycles will be required for the fluorescence signal to rise above background. Thus, the reaction will have a high, or late, Cq. This relationship forms the basis for the quantitative aspect of real-time PCR.
Sample Collection
For RNA isolation and the quantification of gene expression, sample material should be as homogeneous as possible. If your tissue sample consists of many different cell types, pinpointing the expression pattern of your target gene may be difficult. If you have a heterogeneous sample, use one of the many methods that are available for separating and isolating specific cell types, for example, tissue dissection, needle biopsies, and laser capture microdissection. The collected cells can then be used to obtain the RNA samples.
RNA Extraction
Either total or poly(A+) RNA can be used for most real-time RT-qPCR applications. One critical consideration in working with RNA is to eliminate RNases in your solutions, consumables, and labware. Ready-to-use RNase-free solutions can be purchased, or your solutions can be treated with diethyl pyrocarbonate (DEPC) and then autoclaved. RNases on labware can also be inactivated by DEPC treatment or by baking at 250°C for 3 hr.
Prepared RNA samples may need DNase treatment to prevent potential amplification of any contaminating genomic DNA, which could lead to overestimation of the copy number of an mRNA. When starting material is limited, however, DNase treatment may be inadvisable, because the additional manipulation could result in loss of RNA. The amplification of potentially contaminating genomic DNA can be precluded by designing transcript-specific primers, for example, primers that span or amplify across splice junctions.
Analyzing Nucleic Acid Quantity and Quality
Accurate nucleic acid quantification is essential for gene expression analysis, especially when total RNA amounts are used to normalize target gene expression. RNA concentration and purity are commonly determined by measuring the ratio of UV absorbance at 260 nm and 280 nm.

Tired of RNA extractions?
Perform cell lysis and RT-qPCR assays directly from cell cultures with SingleShot™ Cell Lysis RT-qPCR Kits — no RNA purification required.
Two methods are available for quantification of gene expression by RT-qPCR: two-step RT-qPCR and one-step RT-qPCR. In both cases, RNA is reverse transcribed into cDNA, and the cDNA is then used as the template for qPCR amplification. One-step and two-step refer to whether the RT and real-time PCR amplification are performed in the same or separate tubes. In the two-step method, RNA is first transcribed into cDNA in a reaction using reverse transcriptase. An aliquot of the resulting cDNA is then used as a template for multiple qPCR reactions. In the one-step method, RT and qPCR are performed in the same tube.
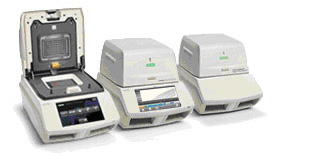
A real-time PCR detection system consists of a thermal cycler equipped with an optical detection module to measure the fluorescence signal generated during each amplification cycle as the fluorophore binds to the target sequence. Bio-Rad real-time PCR detection systems feature thermal cyclers with interchangeable modules for singleplex and multiplex detection of fluorophores as well as fixed real-time PCR units. All qPCR systems feature thermal gradient functionality.

Bio-Rad real-time PCR detection systems.
Videos
This animated video gives you a quick overview of the 1000-series Touch thermal cyclers.
Green I quantitative PCR (qPCR) assay. qPCR assays must be optimized to ensure results that are biologically and statistically significant. Topics include a brief review of qPCR chemistry, with an emphasis on SYBR® Green I reactions, and definitions of the four main characteristics, or hallmarks, of an optimized qPCR assay.
This tutorial pertains to the analysis of real-time quantitative PCR (qPCR) data.


