Multiplexing experiments can generate large amounts of data. For example, running a 27-plex on 80 samples generates 2,160 data points. In this case, using a software package to automate and control data collection settings, organization, and interpretation will improve data consistency. In this section we describe the various elements of a data analysis workflow and the capabilities of the Bio-Plex software.
Related sections: Bio-Plex Assays and Detection of Analytes Using the Bio-Plex System.
-
FEATURED ARTICLEAberrant Cytokine Activity in the Host Immune
Response to COVID-19 Leads to Cytokine
Release Syndrome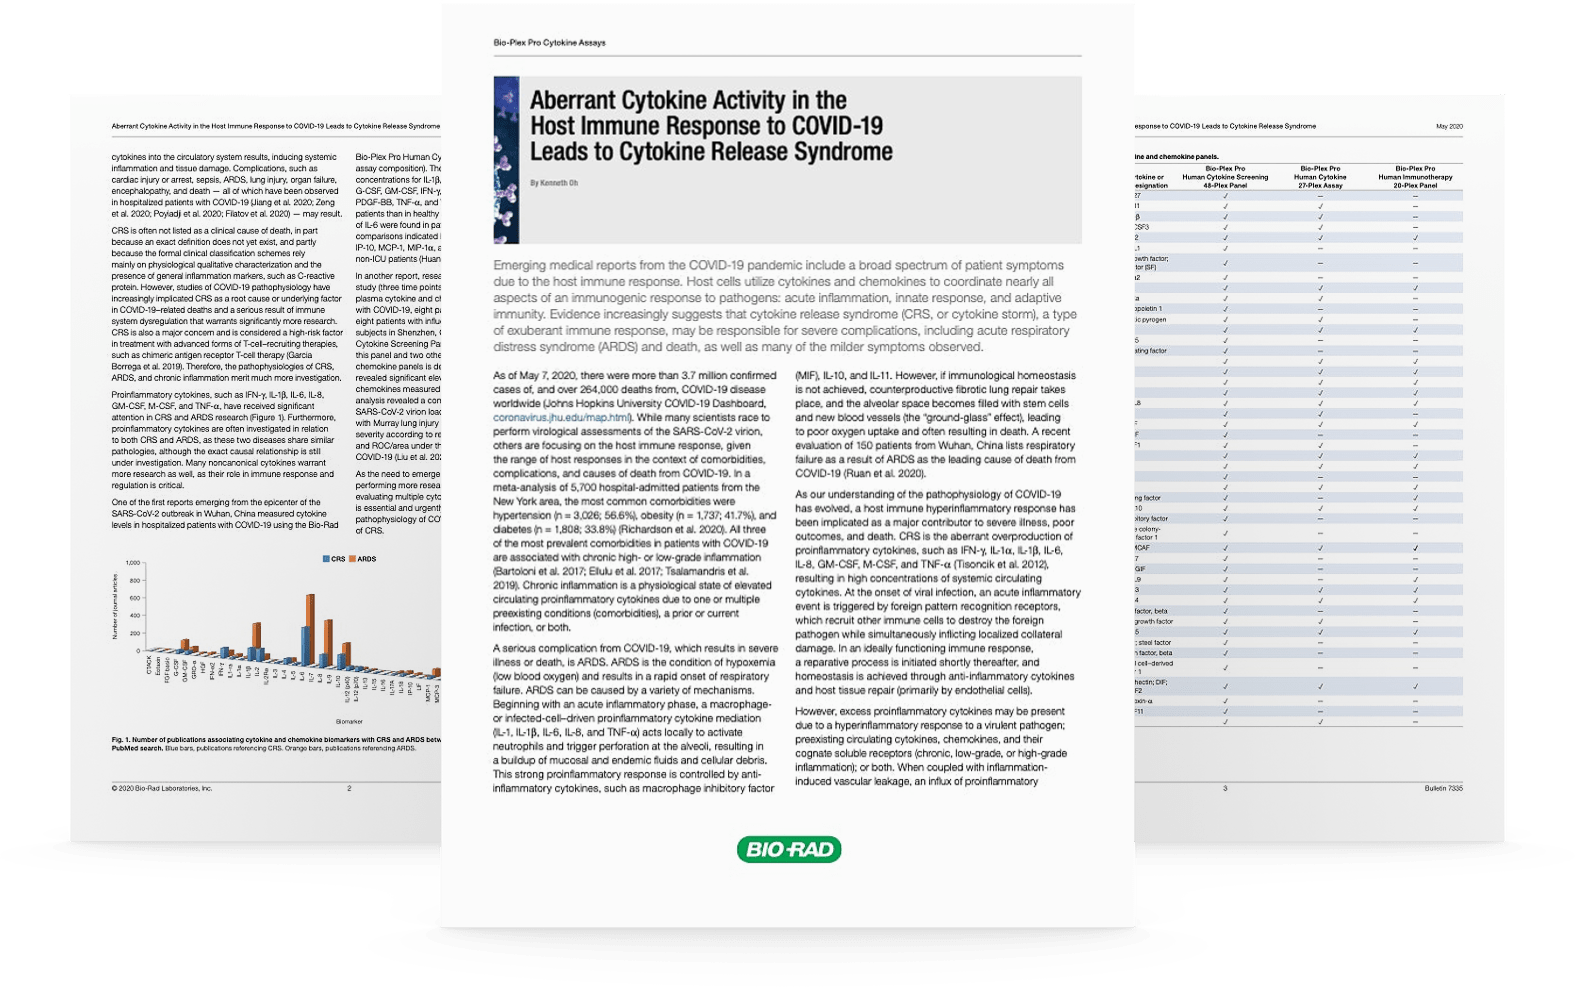
Page Contents
Bio-Plex Manager™ and Bio-Plex Data Pro™ are two Bio-Plex® software programs that offer a wide range of tools for setting up and running Bio-Plex experiments and for analyzing the data generated.
Bio-Plex Manager software is used to:
- Run instruments (Bio-Plex 100 and Bio-Plex 200)
- Evaluate instrument data
- Optimize assay range
- Develop protocols
- Convert xPONENT data to Bio-Plex Manager results
Bio-Plex Data Pro software is used to analyze Bio-Plex data. It can:
- Combine results from multiple instrument runs
- Compare biological replicates
- Organize and visualize experimental results
- Identify which analytes are relevant in your biological system
If you are currently using one of these software programs, please visit our Bio-Plex software resource page to find documentation to help you run your Bio-Plex experiments, analyze your data, and ensure that you have the most recent version of the software.
Collection settings or protocols are set up in the software to ensure that the data collected are optimized for the specified assays. In the context of multiplex immunoassays, a good curve is defined by three main parameters: standard curve recovery, intra-assay CV, and working assay range (Figure 2).
| Intra-assay precision |
Assay working range |
Standard curve recovery |
| Description | Fl | Std Dev | %CV | Conc in Range | Obs Conc | Exp Conc | (Obs/Exp) * 100 |
| S1 | 15364.0 | 254.68 | 1.66 | 46563.49 | 46563.49 | 43441.00 | 107 |
| S2 | 11331.7 | 319.46 | 2.82 | 10109.53 | 10109.53 | 10860.25 | 93 |
| S3 | 6783.3 | 109.65 | 1.62 | 2835.19 | 2835.19 | 2715.06 | 104 |
| S4 | 2760.3 | 63.52 | 2.30 | 673.42 | 673.42 | 678.77 | 99 |
| S5 | 947.3 | 31.18 | 3.29 | 167.19 | 167.19 | 169.69 | 99 |
| S6 | 341.0 | 18.73 | 5.49 | 43.22 | 43.22 | 42.42 | 102 |
| S7 | 153.3 | 2.47 | 1.61 | 10.54 | 10.54 | 10.61 | 99 |
| S8 | 103.3 | 2.29 | 2.22 | 2.64 | 2.64 | 2.65 | 99 |
Fig 2. Critical parameters for an optimized standard curve.
Standard curve recovery is a practical parameter commonly used to determine the overall accuracy of an assay (Wadhwa and Thorpe, 1998). Bio-Plex Manager includes a mechanism for assessing the fit of a standard curve to its individual standard points. This is the recovery percentage. For each analyte standard, an observed concentration is back-calculated by plotting the fluorescence intensity of the standard on the standard curve. This is divided by the expected concentration and multiplied by 100 to give a recovery percentage. The measurement can be performed automatically by software. The output is derived from the assigned (expected) concentration of each standard and the actual (observed) concentration using the formula:
[Observed concentration/Expected concentration] x 100.
Working assay range is defined as the range between the lower limit of quantitation (LLOQ) and the upper limit of quantitation (ULOQ) in which an assay is both precise and accurate. Assay precision evaluates both intra-assay %CV and inter-assay %CV. Intra-assay (within run) %CV assesses variation among the replicates within the assay.
Reliable and reproducible multiplex assays require an instrument with proper optical alignment, reporter performance, and fluidics integrity. This is carried out by performing system validation and verification as well as reader calibration using software products alongside validation and verification kits. The protocols can be automated by the software using kits such as the maintenance, calibration, and validation (MCV) plate (Figure 3). The workflow evaluates the performance of various instrument and operation qualifications, which include optical alignment, integrity of fluidics, performance of the reporter channel, and bead classification efficiency.

Fig 3. Instrument validation and calibration tools.
The Bio-Plex assays use serially diluted standards to generate a calibration or standard curve. A regression analysis is performed to derive an equation that is used to predict the concentrations of unknown samples. The quality of the standard curve has a direct impact on the quality of the extracted concentration values. Therefore proper management of the standard curve is the key to consistent reporting of sample measurement. Software can optimize curve fit by refining the standard curve fit, automatically removing standards from analysis based on recovery values, statistical relevance, and a conservative coefficient of variation.
Bio-Plex Manager software includes a curve fit optimizer, a single click feature that allows users to optimize curves without manually mining the raw data. Multiple data sets can be simultaneously optimized without cycling through several screens to identify outlier data points. This decreases total analysis time and increases the consistency in qualifying raw data. The standard performance criteria used to refine individual standard curves include identifying outliers that demonstrate poor standard curve recovery, poor intra-assay %CV, and saturation or hook effect. The output of the curve fit optimization also includes a report to indicate which curves in a data set have been successfully optimized, could not be optimized, or require user input to further refine data points (Figure 4).

Fig 4. Automated curve fit optimizer.
In general, there are two scenarios where a curve will not fit the data points perfectly. The first scenario is the presence of random variation in the data set. This type of error is designated as pure error and can be reduced by increasing the number of replicates of each standard point. The second scenario is that the curve model may not approximate the true curve very well. This type of error is called lack-of-fit error and cannot be reduced by increasing the number of standard replicates. The curve fit optimizer targets mainly the first type of scenario, as the second scenario is not frequently encountered in Bio-Plex assays, because Bio-Plex software uses the Brendan Scientific five-parameter logistic curve. This algorithm applies the most optimal combinaton of 5 variables to achieve the best fit of the standard points. These models are commonly used to fit sigmoidal shape standard curves (Herman et al. 2008).
Multiplex immunoassay software can provide flexible data organization, which empowers the most inexperienced user to quickly achieve proficiency and deliver results. Some software packages allow for data organization and analysis to be performed as soon as data acquisition starts. Under different data modes, for example raw data mode (Figure 5), the assay bead event histogram can be monitored in real time, reflecting the accumulation of bead counts in their corresponding bead maps as well as the display of fluorescence intensity for each target analyte.
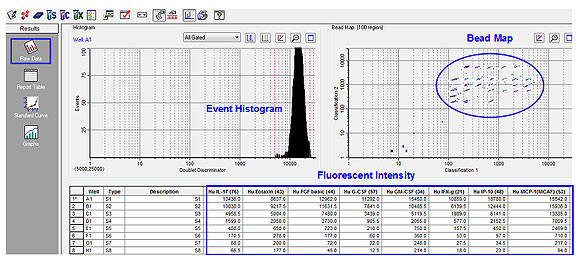
Fig 5. Data organization and real-time analysis of raw data.
In another case, once data acquisition is completed, under report table mode (Figure 6), all the relevant results are displayed in one customizable table, including fluorescence intensity, precision profile, sample concentration, and recovery of the standard curve. The Bio-Plex Data Pro Software functions also allow users to make formatting changes to the raw data tailored to their reporting needs. Some common examples include table layout by either single or multiple analyte, sample organization by type or group, and the option to expand replicate info and/or exclude table error codes.

Fig 6. Data organization and annotation in Bio-Plex Data Pro (Bio-Rad Bulletin 6155).
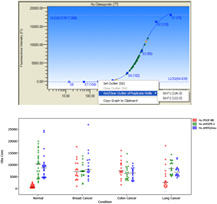
The ability to rapidly visualize data across large data sets and to identify pattern difference in sample grouping is the key to efficient data analysis. There are four main graphing formats to visualize any given data set: samples across a single analyte, samples cross multiple analytes, analytes across a single sample, and analytes across multiple samples.

Fig 7. Data visualization using Bio-Plex Data Pro Software.
In addition to the Bio-Plex Manager software, the Bio-Plex Data Pro software may also be used to visualize and manage data sets from multiple projects. The software is designed to combine data from multiple instrument runs and to visualize customized graphs and tables (for example, bar graph, scatter plot, box and whisker graph) to quickly draw conclusions from a given study. The software also performs standard statistical analysis to assist with data interpretation.
The Bio-Plex Manager output files are designated as "File Extension RBX". These files contain the raw data from a reading, the protocol parameters used to collect the data, and the analysis tools for interpreting the data. In addition to using Microsoft Excel, all the information in an RBX file can also be exported as an XML-formatted text file using the Document Export function in the software (Figure 8). XML is a self-describing universal file format compatible with a wide range of applications. Once exported into XML format, the XML file may be used for data sharing and import into laboratory information system databases and for data analysis using other applications.
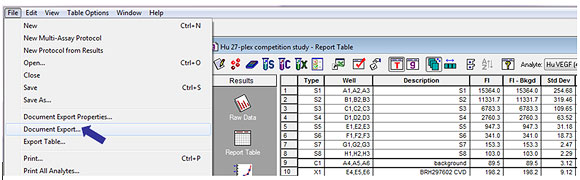
Fig 8. Bio-Plex XML data export.
Alternatively, data files (with *.csv) generated using xPONENT software maybe be converted to an RBX file using Bio-Plex Manger 6.1 (Figure 9). This permits data generated by different software to be shared between different assay vendors or platforms.

Fig 9. *.CSV to *.RBX (Bio-Plex results file) conversion using Bio-Plex Manger 6.1.
Herman RA et al. (2008). Evaluation of logistics and polynomial models for fitting sandwich-ELISA calibration curves. J Immunol Methods 339, 245-258.
Wadhwa M and Thorpe R (1998). Cytokine immunoassays: recommendations for standardisation, calibration and validation. J Immunol Methods 219, 1-5.
Videos


Dr Spinale, Professor of Cardiothoracic Surgery at Medical University of South Carolina, explains how the Bio-Plex system allowed him to tackle important questions in childhood disease research.