
On This Page |
Experiment Planning | RNA Sequence Analysis | Specific Applications | Related Topics and Products |
High-throughput RNA sequencing (RNA-seq) is a standard technique for transcript discovery and differential gene expression analysis in life science laboratories (Stark 2019). This powerful technique is now within the reach of most scientists thanks to innovations in next generation sequencing (NGS) technologies which have dramatically lowered the cost of sequencing. Data analysis is the last step in an RNA-seq experiment. Here, the right choice of software toolkit is critical for performing the necessary quality checks, addressing biases, and ultimately answering the questions posed by the study. This article will provide a quick overview of basic data analysis strategies for coding and non-coding RNAs, as well as important considerations during the experiment planning phase (Babarinde 2019; Conesa 2016).
Experiment Planning
The basic steps of an RNA-seq experiment involve RNA extraction, RNA fragmentation, cDNA generation, library amplification, and sequencing on an NGS platform to get strings of continuous sequence data in “reads”. The most common approach is short-read sequencing (read lengths ≤ 300 bp; RNA-seqlopedia). Careful consideration is necessary at each of these steps to address biases and other factors that can affect the reliability of data and abundance estimates.
Reference Sequence
One important question is whether a sequenced genome is available for the organism of interest. With a well-annotated genome like the human genome, reference transcript sequences are available for RNA-seq analysis. Otherwise, the quantification strategy involves de novo assembly of transcripts followed by mapping onto the transcriptome.
RNA-Seq Library Preparation
The preparation of a sequencing library from RNA is similar to the workflow for genomic DNA samples (see NGS Overview) but requires reverse transcription of the RNA into cDNA. Additional steps are needed to enrich, purify, and amplify the library prior to sequencing. Care must be taken to capture all types and sizes of RNA species to preserve the diversity and quality of RNA libraries, especially with limited or degraded RNA samples.
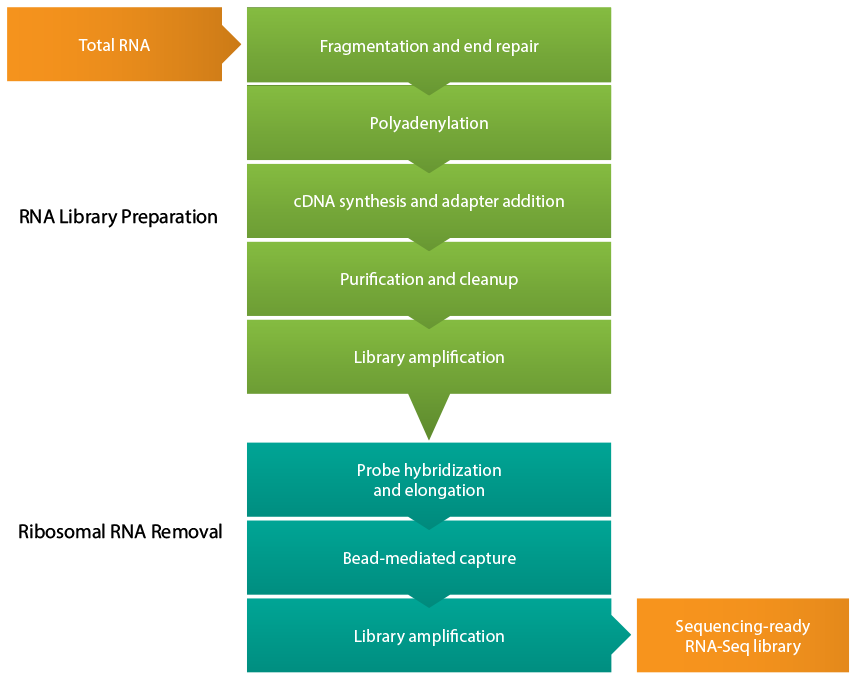
Figure 1: RNA-seq library preparation workflow. After isolating total RNA from the sample of interest, cDNA is synthesized from the RNA, and several steps of purification and amplification are performed to yield a sequencing-ready RNA-seq cDNA library. Efficient removal of ribosomal RNA is critical for effective RNA-seq experiments.
RNA Enrichment
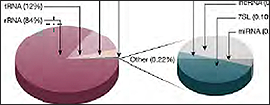
It is critical that the RNA sample being sequenced is enriched for the RNA type of interest, such as messenger RNA (mRNA) or micro RNA (miRNA). Without enrichment, the majority of sequencing reads will correspond to ribosomal RNA (rRNA), which makes up over 90% of the cell’s RNA (Lodish 2000). Without enrichment, the sequencing read would be biased toward the ribosomal RNA. The two methods used to achieve this in eukaryotic cells are rRNA removal and/or poly(A) selection of mRNA using oligo (dT) primers, which requires high-quality, high-abundance mRNA. Short RNAs like miRNA can be isolated by gel electrophoresis.
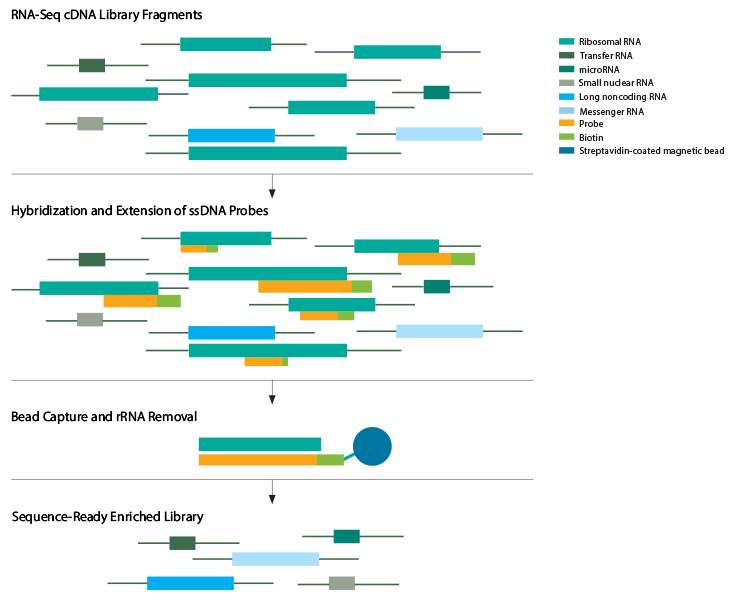
Figure 2: Ribosomal RNA depletion from an RNA-seq library. After the initial library preparation steps of cDNA synthesis, purification, and amplification, cytoplasmic ribosomal RNA (rRNA) and mitochondrial ribosomal RNA (mt rRNA) are eliminated by hybridization with rRNA-specific probes followed by bead capture and removal.
The RNA-Seq library prep workflow can be streamlined by performing ribosomal depletion using the SEQuoia RiboDepletion Kit, featuring a novel post-library preparation depletion technology to effectively eliminate ribosomal and mitochondrial RNA fragments from an RNA-Seq library while retaining rare transcripts commonly lost during pre-library rRNA depletion.
Learn more about SEQuoia RiboDepletion Kit »Strand Preservation
The basic RNA-seq protocol is non-stranded; it does not distinguish between the first and second cDNA strands during cDNA generation. As a result, the link to the original mRNA is lost prior to adapter ligation and subsequent sequencing. Losing this source information can complicate data analysis, especially when studying overlapping transcripts. Stranded (also called directional) RNA-seq first accomplished this by using a modified dUTP nucleotides in place of dTTPs for second-strand cDNA synthesis (Parkhomchuk 2009). This allows for the second strand to be removed by digestion via uracil-N-glycosylase prior to PCR amplification.
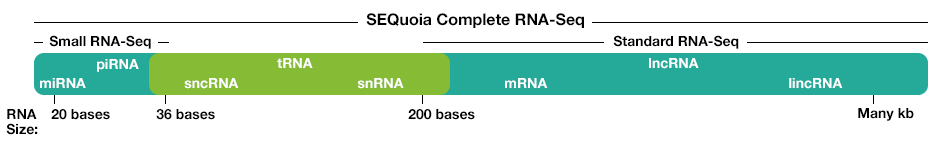
Figure 3: RNA population comparison of SEQuoia RNA-seq library and standard RNA-seq library. The SEQuoia kit captures all RNA biotypes, even from poor-quality RNA such as FFPE tissue samples, enabling researchers to discover biologically relevant differences in more areas of the transcriptome.
Some commercial kits for library generation, like SEQuoia Complete Stranded RNA Library Prep Kit, preserve strandedness without using modified dUTP. The engineered enzyme used in the SEQuoia kit couples cDNA synthesis with adaptor addition at both ends in one continuous reaction. The resulting library is over 99% stranded and captures both long and short RNA types.
Learn more about the SEQuoia RNA Library Prep Kit »RNA-Seq Library Quantitation
Precise quantification of all next-generation sequencing (NGS) libraries is critical for the efficient use of NGS platforms. NGS library quantification provides information about library quality, such as adapter dimers, and indicates library insert size, and enables more efficient and consistent loading of libraries for sequencing runs as well as balancing of pooled library samples.
Bio-Rad's digital PCR platform and library quantification kits can be easily incorporated into the NGS library preparation workflow to precisely quantify and balance sequencing libraries on the Illumina or Ion Torrent Platforms. The ddPCR library quantification assay generates data plots that are rich with qualitative library information, a feature not available with other current methodologies.
Learn more about Digital PCR Library Quantification Kits »Single-Ended or Paired-End Reading
Sequencing can be single-ended (SE) or paired-end (PE). SE reads sequence fragments only from one direction, which may suffice for applications involving well-annotated genomes. The more preferred method uses PE reads, where fragments are sequenced from both directions. This approach is more costly, but provides the best coverage and is ideal for transcript discovery/quantitation, and identifying splicing junctions (Katz 2010). Long-read sequencing technologies can be used with PE reads to improve the specificity of mapping coding and long non-coding RNAs (Łabaj 2011).
Depth and Replicates
The optimal number of reads covering a specific region, or sequencing “depth”, depends on the purpose of the study. In general, deeper sequencing provides better quantification, especially for low-abundance transcripts (Mortazavi 2008). However, the extra coverage in deep sequencing may also amplify noise or off-target reads (Tarazona 2011). The number of experimental replicates in an RNA-seq experiment depend on the inherent variability in the sequencing methodology or the biological system being used. In a gene expression profiling study it is critical that any measured differences in abundance are statistically significant.
RNA Sequence Analysis
Depending on the sequencing technology or application, there are a variety of strategies for processing and analyzing the raw sequencing data. Regardless, the process involves quality control, read alignment (mapping) with or without a reference genome, and other steps for transcript identification, transcript counting, and functional annotation.

Figure 4: RNA-seq data analysis workflow. After isolating and purifying input RNA, cDNA libraries are prepared by converting the RNA into cDNA, and sequencing adapters are added to the ends (short nucleotides with sequences specific to an NGS sequencing platform). Prior to sequencing, cDNA library quantification and quality control measures are completed. After NGS sequencing, analysis of the resulting sequencing reads entails multi-step data processing to assemble overlapping DNA sequences to yield consensus contiguous regions, or “contigs”, in the genome sequence.
In general, there are three steps to the bioinformatics analysis: primary, secondary, and tertiary analysis. Primary analysis is performed on the sequencer itself. For example, Illumina sequencing technology uses cluster generation and sequencing by synthesis chemistry to sequence millions or billions of clusters on a single flow cell, depending on the specific sequencing instrument. During sequencing itself, for each cluster, base calls are made and stored for every cycle of sequencing by software on the instrument. The base call data, which includes the confidence or quality of each base are stored in the form of individual base call (or BCL) files. When the sequencing is completed, the base calls in the BCL files are automatically converted into sequence data. This process is called BCL to FASTQ conversion.
Secondary analysis takes these FASTQ files to either perform an alignment (using a reference genome) or a de novo assembly (without a reference genome). For model organisms, where reference genomes are available, researcher can map individual reads from the FASTQ files to a reference. There are variety of sequence alignment tools available online, including public-domain software such as EMBL-EBI Clustal.
Transcript Mapping
There are two paths for analyzing RNA-seq reads when a reference sequence is available: gene-level or transcript-level mapping. In either case, the reads are mapped to the reference sequence to identify and quantitate the expressed genes. This approach is not used for discovering new transcripts. Reads may also map to one position on the reference sequence, or, in the case of repeating gene sequences, to multiple positions (multiread). Multimapping is more common with a fully annotated reference transcriptome because a read will map to all the annotated isoforms of a gene. Conversely, the same read will map to one loci on the corresponding reference genome. Gene-level mapping is the easiest form of analysis and is suited to straightforward quantification studies of coding transcripts with one dominant isoform.
Reference-Free Mapping
De novo construction is performed when the reference genome is incomplete or one does not exist. In this scenario, an assembly is constructed: short reads are assembled into larger contigs based on areas of sequence overlap, from which a full-length reference transcript is created for mapping. In order to generate adequate coverage for this purpose, PE strand-specific and long-read RNA-seq is preferred to short-read technologies. The software tools for this application include SOAPdenovo-Trans (Xie 2014), Oases (Schulz 2012), Trans-ABySS (Grabherr 2011) or Trinity (Haas 2013). While do novo assembly allows gene analysis from any system, it is less amenable to low-abundance transcripts or genes with complex splicing patterns (Au 2013; Steijger 2013).
Assembly of millions of short sequencing reads into contigs is computationally difficult and requires addressing problems such as sequencing errors, coverage gaps, and the presence of splicing variants. One of two general approaches or algorithms are employed for assembly: overlap graphs and de Bruijn graphs. Early assemblers used pairwise overlaps between reads to extend contigs. These contigs are connected to create the reference. However, this approach is not practical when dealing with hundreds of millions of reads. Therefore, de novo transcriptome asssemblers use De Bruijn graphs, which are constructed and extended based upon k-mers, using a shorter subset of a read, where k is the length of the subsequence. A set of k-mers in a species’ genome, in a genomic region, or in a class of sequences can be used as a signature of the underlying sequence. This makes the assembly process less computationally intensive. Most secondary analysis assembly tools use this De Bruijn graph method (Lin 2016; Chaisson 2008).
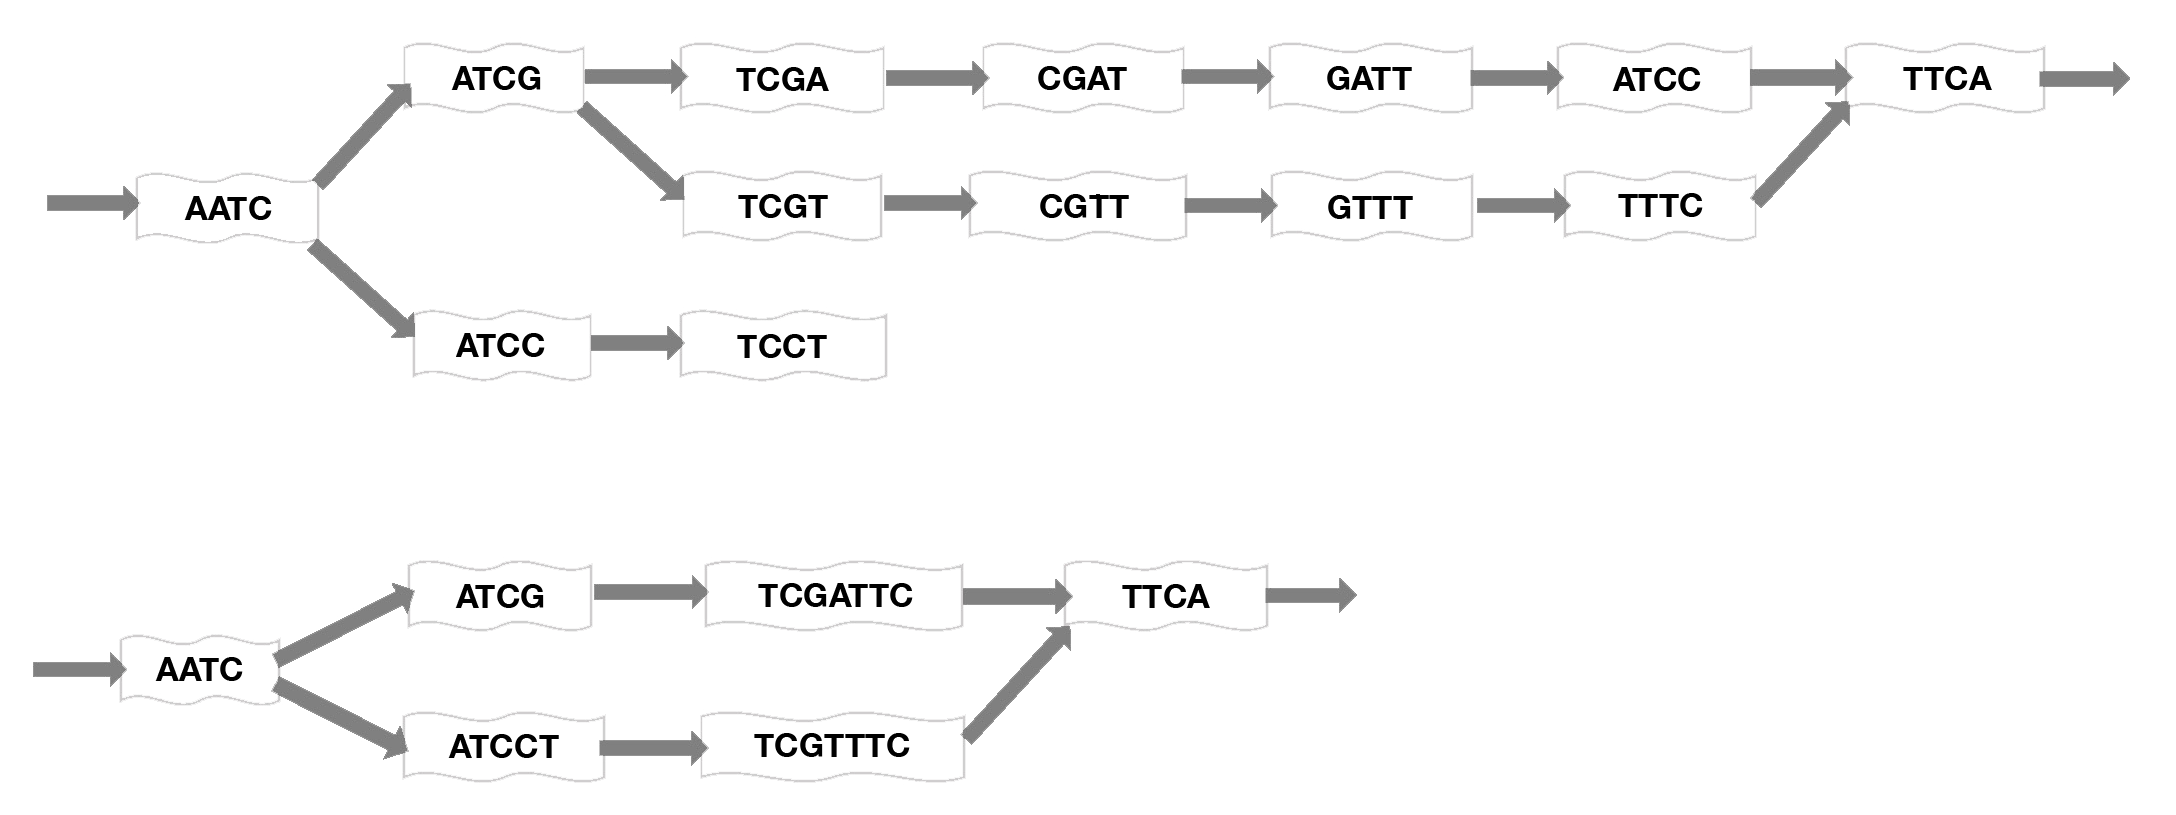
Figure 5. Mapping short reads onto a De Bruin graph. Short sequence subsets, or k-mers, are assembled into contigs using an algorithm that considers each k-mer as a node on a graph then optimizes the graph by connecting edges at overlapping sequences and merging nonbranching paths to a single node to generate the shortest path length. Here, k=4 for example, but much longer sequences would normally be used. Top: initial graphing of sequences onto the map. Bottom: compacted graph produced by merging nodes (adapted from Limasset 2016).
RNA-seq Data Quality Checks
Once a dataset has been mapped or assembled (as part of the secondary analysis), quality checking tools like FASTQC can be used to understand the quality of reads and analysis as well as normalization (RPKM, TPM) and counting (for example, to characterize coverage and number of genes). The purpose of quality control checks of raw reads is to detect PCR bias, contamination, sequencing errors, and other artifacts. These quality checks look for GC content, adapters, number of reads/fragments (k-mers), and duplicate reads. Further, read quality drops towards the 3’ end and can affect transcript mapping. Software toolkits like the FASTX-Toolkit and Trimmomatic (Bolger 2014) can be used to discard low-quality reads.
The percentage of mapped reads (to a reference genome or transcriptome) is also an indicator of sequencing accuracy. A high percentage of mapped reads is expected when a well-annotated genome is available. Conversely, a low percentage can indicate RNA contamination from rRNA or non-coding RNAs. Software packages like NOISeq (Tarazona 2015) or EDASeq (Risso 2011) can be used for such analyses.
The GC content and clustering of mapped reads close to the 3’ end of poly(A)-enriched samples are important indicators of PCR bias and overall RNA quality, respectively. Tools like Picard, RSeQC and Qualimap are useful in quality checks during mapping. Finally, statistical analysis of replicate experiments should indicate a Spearman R2 value which is > 0.9 (Mortazavi 2008). In cases where biological heterogeneity is expected, other forms of statistical analysis are recommended.
A number of software tools are available for data analysis on different RNA-seq platforms. We recommend the use of Bio-Rad’s SeqSense NGS Data Analysis Software. Based on the STAR ultrafast universal RNA-seq aligner (Dobin 2013), the SeqSense RNA-seq data analysis pipeline was designed to leverage the differentiated capabilities of the SEQuoia Complete Stranded RNA Library Prep Kit.
Explore the features and capabilities of SeqSense NGS Data Analysis Software »
Coding vs. Non-Coding RNA
It is well established that coding RNA (mRNA) makes up only a small percentage of the total RNA in the cell. Recent advances in NGS continue to shed light on interesting biological roles and therapeutic opportunities involving non-coding RNAs, including long and small non-coding RNAs. Non-coding RNAs are difficult to sequence due to their low abundance and high-repeat regions. Distinguishing between coding and non-coding RNA using RNA-seq is not a straightforward process, because the existence of an open reading frame is not necessarily indicative of coding potential (Clamp 2007). Additionally, some genes are transcribed into both coding and non-coding transcripts. One strategy to look for “coding potential” uses sequence comparison to other coding sequences based on homology or amino acid similarity. Some of the tools for these types of analyses include BEDTools (Quinlan 2010) and glbase (Hutchins 2014), BLAST (Altschul 1990), BLAT (Kent 2002), GMAP (Wu 2005), and AUGUSTUS (Stanke 2004).
Learn more about Non-Coding RNA (ncRNA) »
Transcript Quantitation
The number of reads that map to a specific transcript on a reference sequence are used to estimate expression levels for that gene. Alignment-based tools for this quantification strategy include RSEM (Li 2011), StringTie (Pertea 2015), eXpress (Roberts 2013), TopHat/Cufflinks (Trapnell 2012), rQuant (Bohnert 2010), MMSEq (Turro 2011), and Scallop (Shao 2017). Alignment-free approaches assess gene expression by counting unique k-mers using toolkits like Sailfish (Patro 2014) or Salmon (Patro 2017).
Ultimately, biologists typically want to understand, interpret, and further analyze their data, which are all part of downstream or tertiary analysis. In tertiary analysis, researchers will perform some comparisons or statistical analyses, such as differential expression or variant analysis, to detect significant polymorphisms. Next, researchers typically annotate their findings, using publicly or privately curated databases such as KEGG, Gene Ontology (GO), or dbSNP.
Specific Applications
Differential Gene Expression Analysis
One of the most common uses of RNA-seq is to determine how gene expression changes in response to disease pathologies, therapeutic intervention, or other stimuli. Differential gene expression (DGE) analysis compares different experimental samples and uses toolkits to evaluate if the observed difference between normalized read counts of a gene is statistically significant (Dündar 2015). DGE is performed following the initial alignment, quantitation and normalization steps, and has two main goals: 1) Assessing the magnitude of the difference, and 2) assessing the significance of the difference. Popular tools in this space are edgeR (Robinson 2010), DESeq/DESeq2 (Anders and Huber, 2010; Love 2014), and limma-voom (Ritchie 2015).
Small RNAs
Small RNAs are a class of non-coding regulatory RNAs that are characterized by lengths shorter than 200 nucleotides. This class includes miRNAs, short-interfering RNAs (siRNAs), and Piwi-interacting RNAs (piRNAs), amongst others. The sequencing strategy for these RNAs are different because most are between 18 and 30 nucleotides. In a standard small RNA-seq experiment, all reads are aligned to a reference genome using tools like Bowtie2 (Langmead 2012), STAR (Dobin 2013), or Burrows-Wheeler Aligner (Li 2009), or aligners like PatMaN (Prüfer 2008) and MicroRazerS (Emde 2010). Contamination from degraded mRNA can skew read data, so it is critical to check for reads that map to high-abundance housekeeping genes.
Alternative Splicing
Differential splicing of mRNA leads to different protein products from a single gene. Many diseases, including cancer have been linked to splicing misregulation, which is why RNA-seq is routinely used to study this phenomena. Alternate splicing is difficult to study using standard short-read RNA-seq; however numerous algorithms are available. The two DGE methods used to analyze alternate splicing are isoform-based (cuffdiff2 and DiffSplice) or count-based, which includes exon-based (DEXSeq, edgeR, JunctionSeq and limma) and event-based (dSpliceType, MAJIQ, rMATS and SUPPA/SUPPA2). Isoform-based methods use sequencing reads to construct the full transcript and measure abundance prior to differential expression analysis (Trapnell 2013; Hu 2013). Count-based methods count different features to determine percentage spliced, exons, and junctions (Anders 2012; Robinson 2010; Hartley 2016; Ritchie 2015; Zhu 2015; Vaquero-Garcia 2016; Shen 2014; Alamancos 2015; Trincado 2018).
Single-Cell RNA-Seq
Single-cell RNA-seq (scRNA-seq) is an emerging technology that reveals the unique gene expression signature of individual cells, which is otherwise lost in bulk studies. These experiments are inherently different from bulk RNA-seq and employ unique workflows and analysis strategies. A common practice in scRNA-seq is the use of spike-in molecules, like the External RNA Control Consortium (ERCC), as an internal control. The number of molecules corresponding to the spike-in is then used to normalize RNA abundance across all single cells. Unique molecular identifiers (UMIs) may also be included to barcode the molecules of interest as a way to control for PCR bias. One of the main challenges with scRNA-seq continues to be the limits on sequencing depth. Some computational tools for scRNA-seq are single-cell normalization (Brennecke 2014), Monocle (Trapnell 2014), and scLVM (Buettner 2015).
Conclusion
RNA-seq has revolutionized the transcriptomics field and new computational tools continue to help tackle the bottlenecks in data analysis and downstream modeling. Single-cell analysis and long-read RNA sequencing are two areas that are quickly evolving, with future developments expected to address limitations with low-abundance starting RNA and constructing long transcripts.
Related Topics and Products

Next-Generation Sequencing
Learn about next-generation sequencing (NGS) methods, the NGS workflow, and key technologies in the development of large-scale genomic sequencing.
RNA-Seq Workflow
A guide to the steps of an RNA-Seq workflow including library prep and quantitation and software tools for RNA-Seq data analysis.
The Non-Coding Transcriptome
Explore the diverse classes of noncoding RNA, the origins of ncRNA species, their biological roles, and clinical implications.
PCR (Polymerase Chain Reaction)
Learn how PCR works, how to choose the right PCR instrument, how to design, optimize, analyze, and troubleshoot PCR assays.

Real-Time PCR (qPCR)
Discover an array of solutions to optimize, execute, and troubleshoot MIQE-compliant real-time PCR experiments.

Introduction to Digital PCR
Digital PCR is a breakthrough technology that provides ultrasensitive and absolute nucleic acid quantification.
Next-Generation Sequencing
Novel products for NGS library preparation and quantitation used in cutting-edge applications such as whole-transcriptome RNA-Seq and single-cell sequencing.

lncRNA RT-qPCR Workflow
This innovative workflow enables highly sensitive detection of long noncoding RNA (lncRNA) and helps to overcome challenges associated with IncRNA expression analysis.

Traditional PCR Systems
DNA amplification instruments range from personal thermal cyclers to the flexible 1000-series.
qPCR Detection Systems
These systems deliver sensitive, reliable detection of both singleplex and multiplex real-time PCR reactions.
PCR & qPCR Reagents
A wide range of reagents for reverse transcription, PCR, and real-time PCR, optimized to generate accurate and reproducible data.

PCR Plastic Consumables
A large selection of thin-wall PCR tubes, plates, seals, and accessories precisely manufactured for optimal fit and cycling performance in Bio-Rad thermal cyclers, real-time PCR systems, ddPCR systems, and all major competitor systems.

PrimePCR PCR Primers, Assays & Arrays
Experimentally validated PCR primer and probe assays for gene expression, copy number variation, and mutation detection analysis for real-time PCR and Droplet Digital PCR.

Droplet Digital PCR Assays
Bio-Rad offers a comprehensive portfolio of Digital PCR Assays and Kits for numerous applications including Mutation Detection, Copy Number Determination, Genome Edit Detection, Gene Expression, Expert Design Assays, Residual DNA Quantification and Library Quantification.
References
Au KF, et al. Characterization of the human ESC transcriptome by hybrid sequencing. Proc Natl Acad Sci 2013;110(50):E4821–30. PMID: 24282307
Babarinde IA, Li Y, Hutchins AP. Computational Methods for Mapping, Assembly and Quantification for Coding and Non-coding Transcripts. Comput Struct Biotechnol J. 2019 May 7;17:628-637. DOI: 10.1016/j.csbj.2019.04.012. PMID: 31193391; PMCID: PMC6526290.
Chaisson MJ, Pevzner PA. Short-read fragment assembly of bacterial genomes. Genome Res. 2008; 18(2):324–30. DOI: 10.1101/gr.7088808
Clamp M. Distinguishing protein-coding and noncoding genes in the human genome. Proc Natl Acad Sci U S A. Dec. 2007;104(49):19428–19433.
Conesa A., Madrigal P, Tarazona S. et al. A survey of best practices for RNA-seq data analysis. 2016 Genome Biol 17, 13. PMID: 26813401 PMCID: PMC4728800 DOI: 10.1186/s13059-016-0881-8.
Dündar F, Skrabanek L, and Zumbo P. Introduction to differential gene expression analysis using RNA-seq. 2015. Updated 2019. Available online at https://chagall.med.cornell.edu/RNASEQcourse/Intro2RNAseq.pdf.
Katz Y, Wang ET, Airoldi EM, Burge CB. Analysis and design of RNA sequencing experiments for identifying isoform regulation. Nat Methods. 2010 Dec;7(12):1009-15. DOI: 10.1038/nmeth.1528. PMID: 21057496; PMCID: PMC3037023.
Łabaj PP, Leparc GG, Linggi BE, Markillie LM, Wiley HS, Kreil DP. Characterization and improvement of RNA-Seq precision in quantitative transcript expression profiling. Bioinformatics. 2011 Jul 1;27(13):i383-91. DOI: 10.1093/bioinformatics/btr247. PMID: 21685096; PMCID: PMC3117338.
Limasset A et al. Read mapping on de Bruijn graphs. BMC Bioinformatics 17, 237 (2016). DOI: 10.1186/s12859-016-1103-9.
Lin Y, Yuan J, Kolmogorov M, Shen MW, Chaisson M, Pevzner PA. Assembly of long reads using de Bruijn graphs. PNAS Dec 2016, 113 (52) E8396-E8405; DOI: 10.1073/pnas.1604560113.
Lodish H, Berk A, Zipursky SL, et al. Molecular Cell Biology. 4th edition. New York: W. H. Freeman; 2000. Section 4.4, The Three Roles of RNA in Protein Synthesis. Available from: https://www.ncbi.nlm.nih.gov/books/NBK21603/.
Mortazavi A, Williams BA, McCue K, Schaeffer L, Wold B. Mapping and quantifying mammalian transcriptomes by RNA-Seq. Nat Methods. 2008;5(7):621-628. PMID: 18516045. DOI: 10.1038/nmeth.1226.
Parkhomchuk D, Borodina T, Amstislavskiy V, Banaru M, Hallen L, Krobitsch S, Lehrach H, Soldatov A. Transcriptome analysis by strand-specific sequencing of complementary DNA. Nucleic Acids Res. 2009 Oct;37(18):e123. DOI: 10.1093/nar/gkp596. PMID: 19620212; PMCID: PMC2764448.
RNA-seqlopedia. Cresko Lab, University of Oregon. https://rnaseq.uoregon.edu/.
Stark R, Grzelak M, Hadfield J. RNA sequencing: the teenage years. Nat Rev Genet. 2019;20(11):631-656. PMID: 31341269. DOI: 10.1038/s41576-019-0150-2.
Stegle O, Teichmann SA, Marioni JC. Computational and analytical challenges in single-cell transcriptomics. Nat Rev Genet. 2015;16(3):133-145. DOI: 10.1038/nrg3833.
Steijger, T., Abril, J., Engström, P. et al. Assessment of transcript reconstruction methods for RNA-seq. Nat Methods 10, 1177–1184 (2013). DOI: 10.1038/nmeth.2714.
Tarazona S, García-Alcalde F, Dopazo J, Ferrer A, Conesa A. Differential expression in RNA-seq: a matter of depth. Genome Res. 2011 Dec;21(12):2213-23. DOI: 10.1101/gr.124321.111. PMID: 21903743; PMCID: PMC3227109.
Further Reading: Sequence Analysis Tools
Alamancos GP, Pages A, Trincado JL, et al. Leveraging transcript quantification for fast computation of alternative splicing profiles. RNA New York, NY 2015;21:1521–31. PMID: 26179515
Altschul SF, Myers EW, Lipman DJ. Basic local alignment search tool. J Mol Biol. Oct. 1990;215(3):403–410. PMID: 2231712
Anders S, Huber W. Differential expression analysis for sequence count data. Genome Biol. 2010;11(10):R106. DOI: 10.1186/gb-2010-11-10-r106. PMID: 20979621; PMCID: PMC3218662.
Anders S, Reyes A, Huber W. Detecting differential usage of exons from RNA-seq data. Genome Res. 2012 Oct;22(10):2008-17. DOI: 10.1101/gr.133744.111. PMID: 22722343; PMCID: PMC3460195.
Bohnert R, Rätsch G. rQuant.web: a tool for RNA-Seq-based transcript quantitation. Nucleic Acids Res. 2010 Jul;38(Web Server issue):W348-51. DOI: 10.1093/nar/gkq448. PMID: 20551130; PMCID: PMC2896134.
Bolger AM, Lohse M, Usadel B. Trimmomatic: a flexible trimmer for Illumina sequence data. Bioinformatics. 2014 Aug 1;30(15):2114-20. DOI: 10.1093/bioinformatics/btu170. PMID: 24695404; PMCID: PMC4103590.
Brennecke P, Anders S, Kim JK, et al. Accounting for technical noise in single-cell RNA-seq experiments [published correction appears in Nat Methods. 2014 Feb;11(2):210]. Nat Methods. 2013;10(11):1093-1095. DOI: 10.1038/nmeth.2645
Buettner F, Natarajan KN, Casale FP, et al. Computational analysis of cell-to-cell heterogeneity in single-cell RNA-sequencing data reveals hidden subpopulations of cells. Nat Biotechnol. 2015;33(2):155-160. DOI: 10.1038/nbt.3102
Dobin A, Davis CA, Schlesinger F, Drenkow J, Zaleski C, Jha S, Batut P, Chaisson M, Gingeras TR. STAR: ultrafast universal RNA-seq aligner. Bioinformatics. 2013 Jan 1;29(1):15-21. DOI: 10.1093/bioinformatics/bts635. PMID: 23104886; PMCID: PMC3530905.
Emde AK, Grunert M, Weese D, Reinert K, Sperling SR. MicroRazerS: rapid alignment of small RNA reads. Bioinformatics. 2010;26(1):123-124. DOI: 10.1093/bioinformatics/btp601
FASTX-Toolkit. https://chagall.med.cornell.edu/RNASEQcourse/Intro2RNAseq.pdf/
Grabherr MG, Haas BJ, Yassour M, Levin JZ, Thompson DA, Amit I, et al. Full-length transcriptome assembly from RNA-seq data without a reference genome. Nat Biotechnol. 2011;29:644–52. PMID: 21572440
Haas BJ, Papanicolaou A, Yassour M, Grabherr M, Blood PD, Bowden J, et al. De novotranscript sequence reconstruction from RNA-seq using the Trinity platform for reference generation and analysis. Nat Protoc. 2013;8:1494–512. PMID: 23845962
Hartley SW, Mullikin JC. Detection and visualization of differential splicing in RNA-Seq data with JunctionSeq. Nucleic Acids Res. 2016 Sep 6;44(15):e127. DOI: 10.1093/nar/gkw501. PMID: 27257077; PMCID: PMC5009739.
Hu Y, Huang Y, Du Y, Orellana CF, Singh D, Johnson AR, Monroy A, Kuan PF, Hammond SM, Makowski L, Randell SH, Chiang DY, Hayes DN, Jones C, Liu Y, Prins JF, Liu J. DiffSplice: the genome-wide detection of differential splicing events with RNA-seq. Nucleic Acids Res. 2013 Jan;41(2):e39. DOI: 10.1093/nar/gks1026. PMID: 23155066; PMCID: PMC3553996.
Hutchins A.P., Jauch R., Dyla M., Miranda-Saavedra D. Glbase: a framework for combining, analyzing and displaying heterogeneous genomic and high-throughput sequencing data. Cell Regen. Jan. 2014;3(1):3:1.
Kent W.J. BLAT--theBLAST-like alignment tool. Genome Res. Apr. 2002;12(4):656–664. PMID: 11932250
Langmead B, Salzberg SL. Fast gapped-read alignment with Bowtie 2. Nat Methods. 2012 Mar 4;9(4):357-9. DOI: 10.1038/nmeth.1923. PMID: 22388286; PMCID: PMC3322381.
Li B, Dewey CN. RSEM: accurate transcript quantification from RNA-Seq data with or without a reference genome. BMC Bioinformatics. 2011 Aug 4;12:323. DOI: 10.1186/1471-2105-12-323. PMID: 21816040; PMCID: PMC3163565.
Li H, Durbin R. Fast and accurate short read alignment with Burrows-Wheeler transform. Bioinformatics. 2009 Jul 15;25(14):1754-60. DOI: 10.1093/bioinformatics/btp324. PMID: 19451168; PMCID: PMC2705234.
Love MI, Huber W, Anders S. Moderated estimation of fold change and dispersion for RNA-seq data with DESeq2. Genome Biol. 2014;15(12):550. DOI: 10.1186/s13059-014-0550-8. PMID: 25516281; PMCID: PMC4302049.
Patro R, Duggal G, Love MI, Irizarry RA, Kingsford C. Salmon provides fast and bias-aware quantification of transcript expression. Nat Methods. 2017 Apr;14(4):417-419. DOI: 10.1038/nmeth.4197. PMID: 28263959; PMCID: PMC5600148.
Patro R, Mount SM, Kingsford C. Sailfish enables alignment-free isoform quantification from RNA-seq reads using lightweight algorithms. Nat Biotechnol. 2014 May;32(5):462-4. DOI: 10.1038/nbt.2862. PMID: 24752080; PMCID: PMC4077321.
Pertea M, Pertea GM, Antonescu CM, Chang TC, Mendell JT, Salzberg SL. StringTie enables improved reconstruction of a transcriptome from RNA-seq reads. Nat Biotechnol. 2015 Mar;33(3):290-5. DOI: 10.1038/nbt.3122. PMID: 25690850; PMCID: PMC4643835.
Prüfer K, Stenzel U, Dannemann M, Green RE, Lachmann M, Kelso J. PatMaN: rapid alignment of short sequences to large databases. Bioinformatics. 2008 Jul 1;24(13):1530-1. DOI: 10.1093/bioinformatics/btn223. PMID: 18467344; PMCID: PMC2718670.
Quinlan A.R., Hall I.M. BEDTools: a flexible suite of utilities for comparing genomic features. Bioinformatics. Mar. 2010;26(6):841–842. PMID: 20110278
Risso D, Schwartz K, Sherlock G, Dudoit S. GC-content normalization for RNA-Seq data. BMC Bioinformatics. 2011 Dec 17;12:480. DOI: 10.1186/1471-2105-12-480. PMID: 22177264; PMCID: PMC3315510.
Ritchie ME, Phipson B, Wu D, Hu Y, Law CW, Shi W, Smyth GK. limma powers differential expression analyses for RNA-sequencing and microarray studies. Nucleic Acids Res. 2015 Apr 20;43(7):e47. DOI: 10.1093/nar/gkv007. PMID: 25605792; PMCID: PMC4402510.
Roberts A, Pachter L. Streaming fragment assignment for real-time analysis of sequencing experiments. Nat Methods. 2013 Jan;10(1):71-3. DOI: 10.1038/nmeth.2251. PMID: 23160280; PMCID: PMC3880119.
Robinson MD, McCarthy DJ, Smyth GK. edgeR: a Bioconductor package for differential expression analysis of digital gene expression data. Bioinformatics. 2010 Jan 1;26(1):139-40. DOI: 10.1093/bioinformatics/btp616. PMID: 19910308; PMCID: PMC2796818.
Shao M, Kingsford C. Accurate assembly of transcripts through phase-preserving graph decomposition. Nat Biotechnol. 2017 Dec;35(12):1167-1169. DOI: 10.1038/nbt.4020. PMID: 29131147; PMCID: PMC5722698.
Schulz MH, Zerbino DR, Vingron M, Birney E. Oases: robust de novo RNA-seq assembly across the dynamic range of expression levels. Bioinformatics. 2012;28:1086–92. PMID: 22368243
Shen S, Park JW, Lu ZX, Lin L, Henry MD, Wu YN, Zhou Q, Xing Y. rMATS: robust and flexible detection of differential alternative splicing from replicate RNA-Seq data. Proc Natl Acad Sci U S A. 2014 Dec 23;111(51):E5593-601. DOI: 10.1073/pnas.1419161111. PMID: 25480548; PMCID: PMC4280593.
Stanke M, Steinkamp R, Waack S, Morgenstern B. AUGUSTUS: a web server for gene finding in eukaryotes. Nucleic Acids Res. Jul. 2004;32:W309–W312. Web Server issue. PMID: 15215400
Tarazona S, Furió-Tarí P, Turrà D, Pietro AD, Nueda MJ, Ferrer A, Conesa A. Data quality aware analysis of differential expression in RNA-seq with NOISeq R/Bioc package. Nucleic Acids Res. 2015 Dec 2;43(21):e140. DOI: 10.1093/nar/gkv711. PMID: 26184878; PMCID: PMC4666377.
Trapnell C, Cacchiarelli D, Grimsby J, Pokharel P, Li S, Morse M, Lennon NJ, Livak KJ, Mikkelsen TS, Rinn JL. The dynamics and regulators of cell fate decisions are revealed by pseudotemporal ordering of single cells. Nat Biotechnol. 2014 Apr;32(4):381-386. DOI: 10.1038/nbt.2859. PMID: 24658644; PMCID: PMC4122333.
Trapnell C, Hendrickson DG, Sauvageau M, Goff L, Rinn JL, Pachter L. Differential analysis of gene regulation at transcript resolution with RNA-seq. Nat Biotechnol. 2013 Jan;31(1):46-53. DOI: 10.1038/nbt.2450. PMID: 23222703; PMCID: PMC3869392.
Trapnell C, Roberts A, Goff L, Pertea G, Kim D, Kelley DR, Pimentel H, Salzberg SL, Rinn JL, Pachter L. Differential gene and transcript expression analysis of RNA-seq experiments with TopHat and Cufflinks. Nat Protoc. 2012 Mar 1;7(3):562-78. DOI: 10.1038/nprot.2012.016. Erratum in: Nat Protoc. 2014 Oct;9(10):2513. PMID: 22383036; PMCID: PMC3334321.
Trincado JL, Entizne JC, Hysenaj G, Singh B, Skalic M, Elliott DJ, Eyras E. SUPPA2: fast, accurate, and uncertainty-aware differential splicing analysis across multiple conditions. Genome Biol. 2018 Mar 23;19(1):40. DOI: 10.1186/s13059-018-1417-1. PMID: 29571299; PMCID: PMC5866513.
Turro E, Su SY, Gonçalves Â, Coin LJ, Richardson S, Lewin A. Haplotype and isoform specific expression estimation using multi-mapping RNA-seq reads. Genome Biol. 2011;12(2):R13. DOI: 10.1186/gb-2011-12-2-r13. PMID: 21310039; PMCID: PMC3188795.
Vaquero-Garcia J, Barrera A, Gazzara MR, González-Vallinas J, Lahens NF, Hogenesch JB, Lynch KW, Barash Y. A new view of transcriptome complexity and regulation through the lens of local splicing variations. Elife. 2016 Feb 1;5:e11752. DOI: 10.7554/eLife.11752. PMID: 26829591; PMCID: PMC4801060.
Wu TD, Watanabe CK. GMAP: a genomic mapping and alignment program for mRNA and EST sequences. Bioinformatics. May 2005;21(9):1859–1875. PMID: 15728110
Xie Y, Wu G, Tang J, et al. SOAPdenovo-Trans: de novo transcriptome assembly with short RNA-Seq reads. Bioinformatics. 2014;30(12):1660-1666. PMID: 24532719. DOI: 10.1093/bioinformatics/btu077
Zhu D, Deng N, Bai C. A generalized dSpliceType framework to detect differential splicing and differential expression events using RNA-Seq. IEEE Trans Nanobioscience. 2015;14(2):192-202. DOI: 10.1109/TNB.2015.2388593.