
High resolution melt analysis (HRM analysis) is the quantitative analysis of the melt curves of product DNA fragments following PCR amplification. HRM can be considered the next-generation application of amplicon melting analysis. High resolution melting assays require a real-time PCR detection system with excellent thermal stability and sensitivity and HRM-dedicated software. The combination of improved qPCR instrumentation and saturating DNA-binding dyes has permitted the identification of small variations in nucleic acid sequences by the controlled melting of double-stranded PCR amplicons. New instrument calibration methods coupled with HRM-compatible software permit the rapid analysis of the resulting data sets and the discrimination of DNA sequences based on their composition, length, GC content, or strand complementarity (Garritano et al. 2009). This section provides an overview of HRM analysis including melt curve data processing, instrumentation, reagents, and its application to epigenetics studies.
Related Topics: qPCR Assay Design and Optimization and qPCR/Real-Time PCR.
Page Contents
HRM experiments generate DNA melt curve profiles that are both specific and sensitive enough to distinguish nucleic acid species based on small sequence differences, enabling mutation scanning, methylation analysis, and genotyping (Garritano et al. 2009). HRM analysis is a nondestructive method, so subsequent characterization of the associated amplicon, for example, using gel electrophoresis or sequencing, can be performed after melt analysis.
Melt curves are routinely run for qPCR experiments to ensure primer specificity, with data typically collected over a temperature range of 65–95°C in 0.5°C increments. For HRM experiments, data are generally collected at narrower temperature increments than for standard melt curve protocols, commonly in 0.2°C increments. Depending on the particular template and experimental conditions, the increased density of data points collected can assist with melt profile generation and subsequent sequence discrimination. HRM analysis software is then used to identify areas of stable pre- and post-melt fluorescence intensity from the HRM curve (Figure 1A). These signals are then automatically normalized to relative values of 1.0 and 0, respectively (Figure 1B), eliminating differences in background fluorescence and increasing the ability to detect subtle melt profile differences. Both melting temperature shifts and curve shape can be used to identify sequence differences. Homozygous allelic/sequence variants are typically characterized by the temperature (x-axis) shift observed in an HRM melt curve (Figure 1, red and blue traces), whereas heterozygotes are commonly characterized by a change in melt curve shape generated from base-pairing mismatches (Figure 1, green trace) as a result of destabilized heteroduplex annealing between some of the wild-type and variant strands. HRM data are often plotted as difference curves to visually magnify differences between the melt profiles of different clusters within the same genotype (Figure 1C).
A. Melt Curve
B. Normalized Melt Curve
C. Difference Curve
Fig. 1. HRM analysis: Melt curves. Data were generated using the CFX96™ real-time PCR detection system and analyzed using Precision Melt Analysis™ software. Pre-melt (initial) and post-melt (final) fluorescence signals of all samples (A) were normalized to relative values of 1.0 and 0 (B). Curve differences were magnified by subtracting each curve from the most abundant type or from a user-defined reference (C). The green and red boxes indicate the pre- and post-melt regions, respectively, used for data normalization. RFU, relative fluorescence units.
Analyzing the data in a temperature-shifted view (in which the curves are shifted along the temperature axis so that they are superimposed at a particular fluorescence intensity value) can assist in discriminating these duplex types (Figure 2).
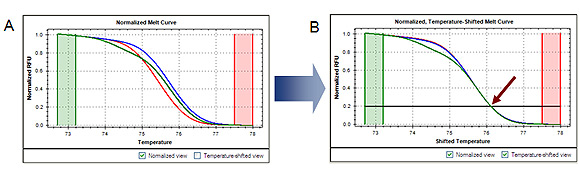
Fig. 2. Temperature-shifted melt curves. Shifting the normalized melt curves (A) along the temperature axis so that they are superimposed at a specific fluorescence intensity (indicated by arrow, B) enhances visualization of the presence of heteroduplex and homoduplex DNA. RFU, relative fluorescence units.
Various designs of HRM-compatible qPCR instruments are available. Access to the following features enables rapid generation of robust HRM data:
- Flexible input sample volume (5–50 µl)
- Standard 96- and 384-well formats for increased throughput and streamlined reagent dispensing
- Gradient-enabled thermal block for fast reaction optimization
- No requirement for proprietary dyes, consumables, or reagents
- Fast, accurate, and uniform thermal control with proven ability and sensitivity to resolve class I–IV SNPs
While all qPCR instruments are packaged with analysis software, not all software packages are suitable for HRM analysis. HRM-compatible software should allow the user to:
- Compare and combine data from multiple experiments by combining run results into a single melt study
- Display a plate view for easy identification of sample genotypes
- Share analysis settings among experiments
- Analyze multiple experiments on a single plate
- View all charts in a single window for simplified data analysis and interpretation
Analyzing short DNA amplicons can assist with genotype discrimination in HRM experiments. Whenever possible, analyzing amplicons smaller than 100 bp is preferable, especially when sites with a known polymorphism are investigated. Reducing amplicon size increases the difference in signal at a given temperature (which reaches a maximum at the melting temperature, Tm) between two sequences that differ at only one nucleotide position, known as single-nucleotide polymorphisms (SNPs). This increased difference in turn improves statistical confidence in calling particular SNPs between samples. This discrimination is particularly important when analyzing class III and IV SNPs. A number of programs are available to help design primer pairs and select target sequences. Primer-BLAST, a freeware option for designing oligonucleotides, is a program developed by the National Center for Biotechnology Information that uses the Primer3 algorithm. Primer sequences are compared with user-selected databases to ensure that they are unique and specific for the gene of interest. The commercial Beacon Designer program (PREMIER Biosoft International) facilitates the design of HRM-specific primers flanking an SNP of interest to generate the shortest possible amplicons with a detectable melting temperature difference. It is good practice to design and validate three sets of primers to increase the chances of identifying a highly robust pair.
Inconsistent data may be the result of secondary structures in single-stranded or partially denatured DNA. Amplicon sequences should be tested with MFOLD to ensure they do not form secondary structures during PCR that can increase the complexity of melting profile interpretation. The DINAMelt server is also a useful tool to assess target melt domain complexity.
HRM analysis requires a saturating concentration of double-stranded DNA (dsDNA) binding dyes that do not inhibit PCR. Dyes possessing these characteristics are referred to as "third-generation dyes." The saturating concentration prevents dye molecule redistribution during melting, providing superior melt curve resolution. Unlike SYBR® Green, third-generation dyes such as EvaGreen and LCGreen can be used at high concentrations because they do not inhibit DNA polymerases.
Highly specific PCR amplification is essential to ensure accurate high resolution melt curves. Hot-start DNA polymerases that do not inhibit PCR. Dyes possessing these characteristics are referred to as "third-generation dyes." The saturating concentration prevents dye molecule redistribution during melting, providing superior melt curve resolution. Unlike SYBR® Green, third-generation dyes such as EvaGreen and LCGreen can be used at high concentrations because they do not inhibit DNA polymerases.
The success of HRM analysis depends on the quality of the individually amplified PCR products as well as the post-PCR melting protocol and the specific sequence under investigation. Each experimental parameter must be controlled and highly reproducible from sample to sample to ensure successful and reproducible results. Analyzing real-time PCR amplification data prior to HRM analysis can be extremely useful when troubleshooting HRM experiments.
Epigenetics is the study of changes in gene expression patterns due to mechanisms other than mutations in the underlying DNA sequence. Epigenetic modifications involve alterations in the structural packaging of DNA, leading to phenotypic diferences inherited by daughter cells during cell division.
The ability of HRM analysis to discriminate differences in base pairing has been utilized to examine DNA methylation patterns. A common technique for assessing DNA methylation involves the use of sodium bisulfite chemistry to differentially convert unmethylated cytosine residues to uracil while leaving methylated cytosines unmodified. Following bisulfite treatment and PCR amplification, target DNA can be examined by HRM. The lower melting temperature of DNA containing uracil in place of cytosine allows a researcher to discriminate between methylated and unmethylated DNA. A high bisulfite-mediated conversion efficiency and a highly specific PCR product are essential for the effective use of HRM analysis in methylation studies.
It is important to note that HRM methylation analysis identifies only the overall methylation status of the amplified region and does not provide information on the methylation status of individual CpG sites. However, because HRM analysis is nondestructive, PCR reaction products can be sequenced to elucidate specific positions of DNA methylation.
Garritano S et al. (2009). Determining the effectiveness of high resolution melting analysis for SNP genotyping and mutation scanning at the TP53 locus. BMC Genet 10, 5.
Garritano S et al. (2009). Determining the effectiveness of high resolution melting analysis for SNP genotyping and mutation scanning at the TP53 locus. BMC Genet 10, 5. PMID: 19222838
Erali N et al. (2008). High-resolution melting applications for clinical laboratory medicine. Exp Mol Pathol 85, 50–58. PMID: 18502416
Martino et al. (2010). Application of high-resolution melting to large-scale, high-throughput SNP genotyping: A comparison with the TaqMan method. J Biomol Screen 15, 623–629. PMID: 20371868
Temesvári M et al. (2011). High-resolution melting curve analysis to establish CYP2C19∗2 single nucleotide polymorphism: Comparison with hydrolysis SNP analysis. Mol Cell Probes 25, 130–133. PMID: 21315147
Vossen RH et al. (2009). High-resolution melting analysis (HRMA): More than just sequence variant screening. Hum Mutat 30, 860–866. PMID: 19418555
Warnecke PM et al. (1997). Detection and measurement of PCR bias in quantitative methylation analysis of bisulfite-treated DNA. Nucleic Acids Res 25, 4422–4426. PMID: 9336479
Wojdacz TK and Dobrovic A (2007). Methylation-sensitive high resolution melting (MS-HRM): A new approach for sensitive and high-throughput assessment of methylation. Nucleic Acids Res 35, e41. PMID: 17289753