
Better Image Acquisition
Imaging basics explained.
On This Page | Sensitivity | Signal & Background | Resolution & Binning | Dynamic Range | Fluorescent Detection | Instrumentation | Tips | Protocols & Resources |
Sign Up for Western Blotting Tips and Webinar Alerts
The goal of the western blotting image acquisition step is to convert the physical western blot into an image to visualize the protein bands that can then be analyzed for protein molecular weight and quantity. Traditionally, protein signal on blots was generated colorimetrically or using chemiluminescent substrates and captured using film. Only rough estimates of protein quantity could be inferred by eye, but converting that film image into a digital image allowed more accurate analysis of the data. Modern digital imagers skip this film step and directly capture blot images digitally.
In this section, we explain the basic concepts behind digital imaging as it pertains to modern western blotting to help you select the best imaging system and to get the most accurate and quantifiable data from your blots.
Imaging Sensitivity
One of the most common challenges for a western blotting experiment is the detection of low-abundance protein targets. This requires optimization of all the upstream steps of the western blotting workflow as well as an imaging system that has the highest sensitivity possible.
In western blotting, sensitivity of imaging instruments is often discussed using two somewhat differing definitions. Often, two imagers are evaluated by imaging the same blot with identical imaging times and comparing the resulting band intensities. While quick and easy to perform side-by-side, this method compares time to results, rather than the ultimate sensitivity of the imagers.
It is important to consider the instrument with the lower ultimate limit of detection, as long as it takes a reasonable amount of time to acquire that image. After all, the whole western blotting experiment can take upwards of two days so a few extra minutes during image acquisition is a small price to pay to see a low-expressing protein.
Definitions of Sensitivity
<
>
System A: Exposure time, 30 seconds
Intensity = 10,000
Signal to Background = 100
System B: Exposure time, 30 seconds
Intensity = 5,000
Signal to Background = 700
Time to Results
When evaluating candidate imaging systems for purchase, many researchers will take images of the same blot using identical (or near identical) settings. Band intensity is often used to compare imaging systems. This method provides a rough comparison of sensitivity, but if only intensity is evaluated and not measurements of signal to background or signal to noise, the system's limit of detection can be misestimated.
Limit of Detection
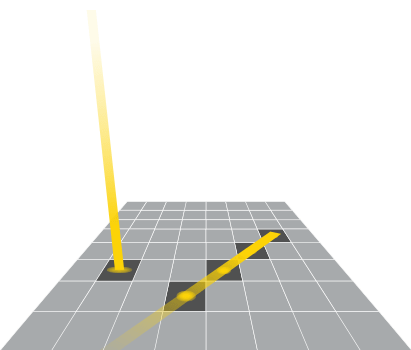
The limit of detection is the lowest intensity that can be confidently identified within a background. For a single pixel, one common definition is the lowest intensity that can be identified with a 99% confidence (example, greater than or equal to three standard deviations of baseline noise.)
In this example, even though system B shows a lower band intensity, it has superior signal to background so would be able to detect a fainter signal on the blot with a longer exposure time.
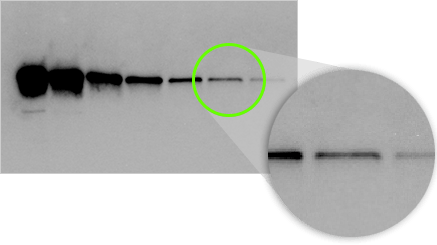
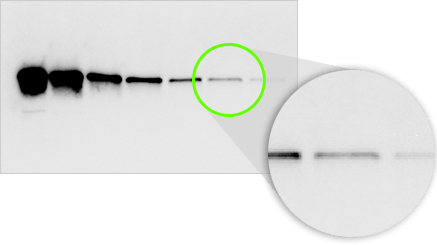
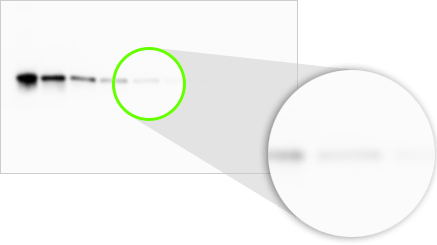
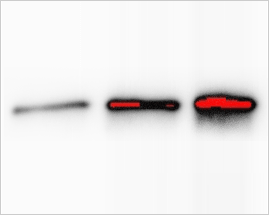
Visual Limit of Detection
On a western blot, we are detecting bands that have an expected size and shape, rather than single pixels. Our eyes can discern even very faint bands above background given the knowledge of this size and shape.
In this example, the last two bands in this serial dilution are visible to the eye, even though the pixels making up the band are barely above background.
Signal, Background, and Noise in Western Blot Imaging
Optimization of the upstream steps of western blotting for maximum sensitivity is largely about maximizing signal while minimizing background. Selection of an imaging system is no different and the most sensitive systems can detect low signal while introducing low levels of background noise that may obscure detection of that signal.
Two important and related measures of an imaging system’s performance are: its ability to generate images with a high signal-to-background, and high signal-to-noise ratios. Understanding both will allow you to better evaluate an imaging system and any images taken with that system.
Signal-to-Background
The goal for researchers performing western blots is to maximize the band from the protein of interest while minimizing the background seen on the membrane. This background is often a result of incomplete blocking, insufficient washing of excess antibody, or an improperly hydrated PVDF membrane (when using fluorescence detection).
Signal to Noise
Noise is the statistical uncertainty when measuring the intensity at a pixel. For example, a pixel may have a value of 1,000 during one instance, but a value of 1,100 the second time it is measured. This variation relates to the amount of noise that is accumulating within that signal. While a uniform background is relatively easy to subtract, noisy background may obscure a weak signal and is difficult to subtract from the analysis.
Signal to Background Measurement


High signal with uniform background. One common signal to background measurement is the intensity of the pixel divided by the mean intensity of the background pixels.
Signal:background =
Pixel intensity
Average background intensity
If background is uniform, subtraction is straight forward, and the signal can be easily distinguished.
Signal-to-Noise Measurement


High signal with noisy background. A signal to noise measurement would be the intensity of the pixel divided by the standard deviation in the intensities of the background pixels.
Signal:noise =
Pixel intensity
Standard deviation of background intensity
Signal among high noise can make background subtraction difficult.
Signal Collection
The entire system matters. Detection of low-expressing proteins requires that all parts of an imaging system work together to most efficiently gather the light from the blot.

Assay
A good image starts with a good blot. Whether the blot is chemiluminescent or fluorescent, proper upstream processing is critical for sensitive and quantitative detection of your protein.

Lens
Light that is generated from the blot must be collected efficiently for maximum sensitivity. The light-gathering ability of a lens is given by the focal ratio, or f number and is the ratio of the focal length to the diameter of the aperture. A lens with a large aperture will admit more light and is given a lower f number. Western blot imaging systems with lenses with lower f numbers will be more sensitive.
F number, N =
focal length, f
Diameter of open aperture, D
The most sensitive systems can use lenses with f numbers as low as 0.94.
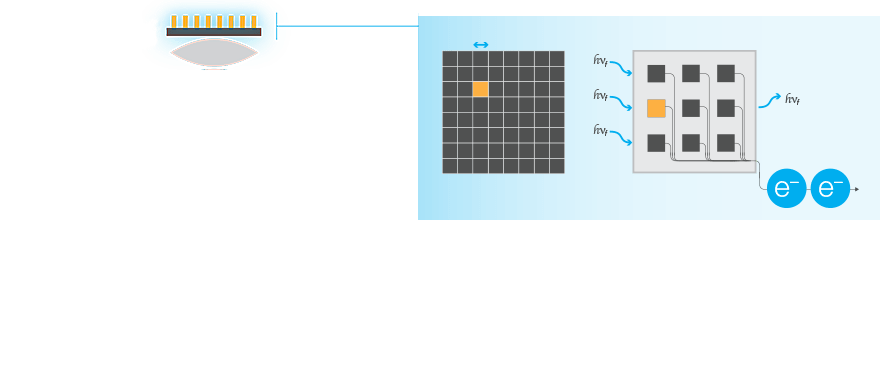
Sensor
Light that is collected by the lens must then be efficiently captured and converted to an electronic signal by the image sensor. Two primary factors are the physical size of the pixels and their quantum efficiency.
The physical size of a pixel, called pixel pitch, is presented to incoming photons for a given pixel. Larger pixels act as larger buckets and can capture more photons. For a given sensor size, there is a tradeoff with resolution since the same area divided amongst a greater number of pixels means each pixel is physically smaller.
Quantum efficiency is similar in concept to the quantum yield measurement for fluorophores. It is the percentage of incident photons that are then converted to an electrical signal as electrons by the sensor. Note that for any given sensor, quantum yields vary across the spectrum.
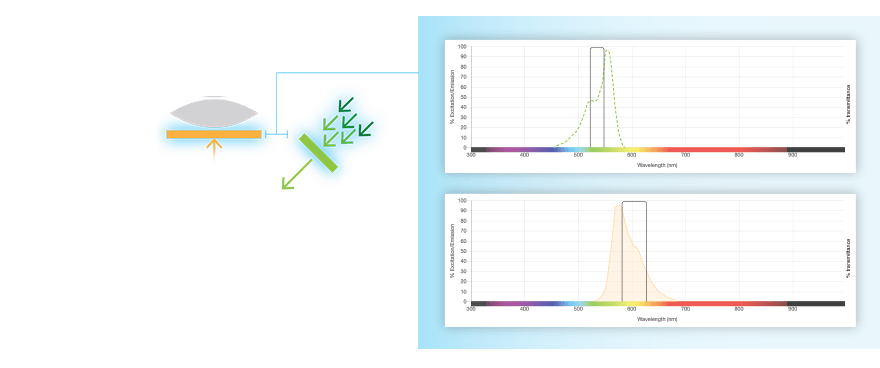
Optical Filters
For fluorescent western blots, proper optical filtering to only allow the right wavelength to pass the excitation and emission filters is critical to acquire images with high signal and low background.
Sources of Noise
Selection of the best reagents and proper upstream processing is not only critical to minimizing background, but also for sensitive western blots. To get the most out of your western blot, it is important to understand and select an imaging system that minimizes the introduction of noise or background into the blot image.
The major electronic sources of noise and background in a western blot image are read noise and dark noise produced within the camera, and the shot noise, which is from the statistical behavior of photons striking the sensor.
Read Noise
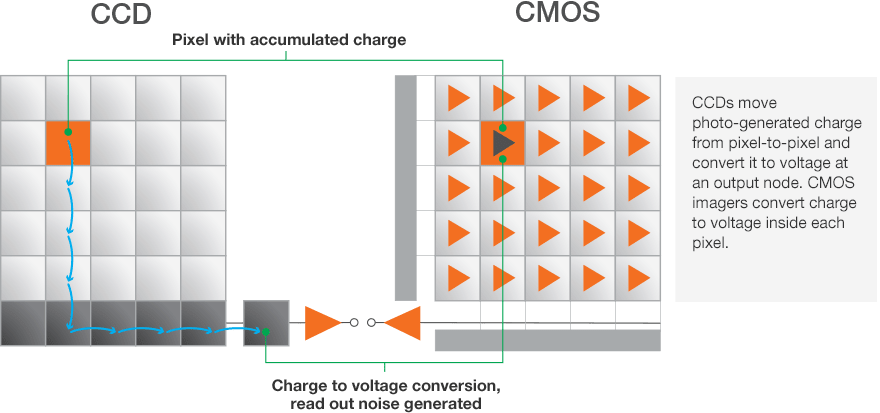
When an image sensor is read out, the accumulated charge in each pixel must be converted from an analog quantity to a digital signal. This action of reading each pixel introduces noise by the electronics within the camera. High read noise contributes to overall noise in an image and may obscure faint signals that are just at the noise floor.
With CCD cameras, the charges of all pixels are converted to voltage through a common pipeline off of the chip so they are subject to the same source of noise. However, with CMOS sensors, each pixel has its own associated amplifier so each pixel has its own amount of associated read noise that may vary slightly between pixels.
Whether based on mature CCD sensors or newer CMOS chips, Bio-Rad engineers have designed cameras with circuitry and components to minimize read noise during image acquisition in order to maximize sensitivity.
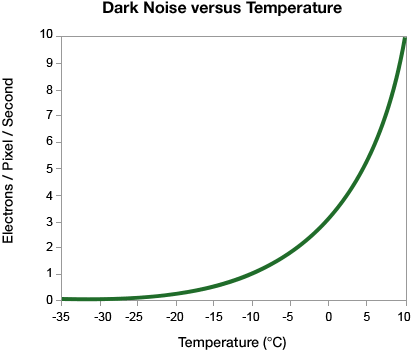
Dark Current
Dark current is the electric current that is generated through a CCD or CMOS chip even when no photons are striking the sensor. It is generated by the thermal energy in the silicon and is dependent on the temperature of the sensor. Higher temperatures cause greater dark current. Excessive dark current is controlled by cooling the sensor. Note that the largest reduction occurs with just a few degrees of cooling and a point of diminishing returns is typically achieved between –5°C and –10°C
The thermal energy from the dark current also carries a statistical fluctuation that is called dark noise. Since the noise generated by dark current follows Poisson statistics, the dark noise scales with the square root of the dark current. For western blotting imagers, active sensor cooling reduces dark noise so much so that it is usually small relative to read noise, until exposure times become lengthy, around 5 minutes.
Bio-Rad imagers designed for chemiluminescent detection actively cool the chip and maintain a constant temperature to minimize dark current to enable long exposures with minimal background noise.
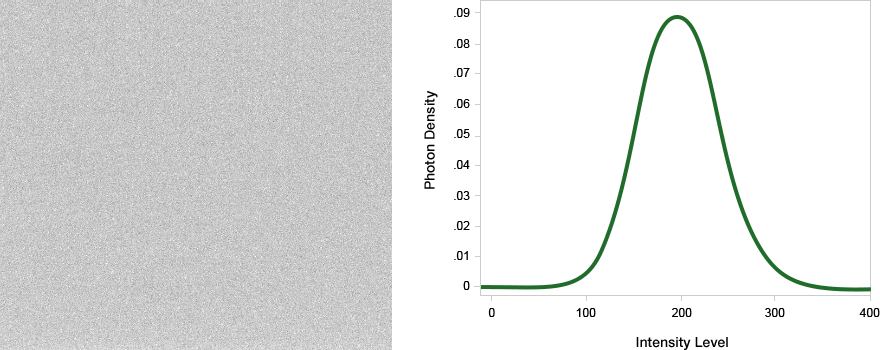
Shot Noise
Shot noise, or photon noise, is the statistical noise associated with the discrete arrival of individual photons to a pixel on a sensor. Since photons act as discrete packets, their measurement obeys Poisson statistics.
An important characteristic of Poisson statistics is that the standard deviation of a measurement is equal to the square root of the average. For example, if 10,000 photons are collected on average, the standard deviation would be about 100. But if on average 100 photons are collected, the deviation from the average will be 10. This means that as the light intensity increases, the shot noise also increases, but at a slower rate. Since signal increases linearly, but shot noise increases at the square root of the intensity, the signal-to-noise ratio actually improves with increasing intensity. Thus, shot noise is more apparent at low illumination than at high illumination.
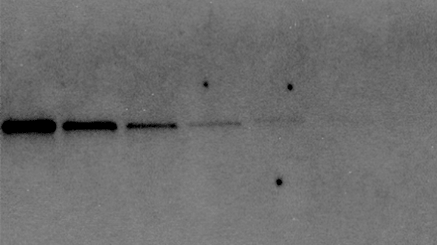
Cosmic Rays
For chemiluminescent blots, detection of low abundance proteins often require exposure times of several minutes. During this time, high-energy cosmic rays may strike the sensor, causing an increase in charge in a pixel, which is indistinguishable from the normal arrival of photons. Depending on the angle that the ray strikes the chip, it can leave an artifact in the shape of a bright dot (when the ray hits the sensor straight on) or as a streak (when the ray strikes the sensor at a low angle).
Exposure times of a few minutes can collect several such cosmic ray events. Since the bands on western blots are fairly large, and the artifacts caused by cosmic rays are small dots or a streak of only a single pixel wide, software algorithms such as those in Bio-Rad imaging systems, can be used to remove these artifacts from the image.

How Noise Scales with Exposure Time
The different sources of noise from the imaging system scale respond differently to increasing exposure times:
- Signal from the blot increases
- Read noise is constant
- Dark noise increases
- Cosmic rays increase
- Shot noise increases (but at a slower rate than signal)
Most western blot imagers allow the acquisition of several short exposures to be combined into a single image. This is useful for getting a general idea for a target exposure time. Since read noise is constant for each exposure, the noise is additive when combined into the final image, these stacked images have higher noise than if a single long exposure were taken. For this reason, Bio-Rad imaging systems use sophisticated auto-exposure algorithms to arrive at the appropriate exposure time to eliminate the need for adding several images together.
Learn How Our Digital Imaging Systems are Engineered for Maximum Sensitivity in Western Blotting »
Resolution and Sensor Binning
Most researchers want to capture their western blot images with the best resolution possible in order to have a sharp and visually pleasing image for publication or analysis.
Optical resolution: the ability to resolve or distinguish closely spaced features.
Spatial resolution: the total number of pixels in an image
Optical or spatial resolution is the ability of an imager to be able to distinguish object detail or two closely spaced features. Keep in mind, this is different than the total number of pixels in an image, which is also commonly referred to as spatial resolution. It is possible to capture an image with a high number of pixels, but due to poor lens design, is too blurry to distinguish between two closely spaced bands. The extra pixels in the image are therefore “empty resolution” and do not contribute to data accuracy nor information in the image.
Low- and High- Optical Resolution Images

Both images have the same image resolution (same number of pixels), but the image on the left has higher optical resolution, showing finer detail.
In western blotting, the bands on a gel or blot are typically several millimeters wide and 0.5 millimeters thick, relatively large compared to features that are imaged in other laboratory techniques, such as microscopy. Therefore, the optical constraints that are encountered in microscopy such as limitations based on the wavelength of light do not apply.
For blot imagers, the resolving power of an imager is primarily dependent on distance to the sample, the quality of the lens, and the sensor resolution. Image quality will be limited by the weakest link of the imaging system. A high-megapixel sensor cannot capture a good image with poor lens.
Factors Affecting Resolution

1
Distance to sample
Greater distances between the blot and the camera make it more challenging to capture an image with fine detail. To overcome this, some imagers have mechanical zoom systems that physically reposition the camera and the blot closer to each other.
2
Lens
High-quality lenses that introduce a minimum of distortion are needed for high-resolution images. High-quality lenses are required for both high resolution and sensitivity (low f numbers).
3
Sensor
A sensor of sufficient spatial resolution is needed to capture the output of a high-resolution lens. The quality of the final image will be limited by the component with the worst quality, so resolution of the sensor and lens must be considered.
Binning
Binning is the process of combining the signal from adjacent pixels of a sensor into a single larger effective pixel (often called a “super pixel”). These larger "super pixels" capture photons more effectively, increasing sensitivity and requiring shorter exposure times, but with a loss of resolution.
What is binning?

1x1 (No binning)

2x2 Binning

3x3 Binning
Just like a larger bucket catches more rain drops, larger pixels can capture more photons. With CCD and CMOS sensors, adjacent pixels can be combined to act as a single pixel with a larger effective size. These larger pixels capture more photons and increase sensor sensitivity.
To understand the increase of sensitivity, remember that with CCD sensors, read noise accumulates during the readout event of each pixel. When utilizing binning, the charge from individual pixels is combined into larger super pixels, and it is that super pixel that is read by the sensor electronics. Thus, the signal from each individual pixel is added, but the read noise is from the single read event of the super pixel. This increases the signal-to-noise ratio and therefore the sensitivity.
With CMOS sensors, each pixel is read individually and has its own small amplifier so there is not the same benefit to binning that CCD sensors enjoy. However, there is still a benefit mathematically. Since the noise between binned pixels is uncorrelated, the additive noise does not scale linearly, but rather with the square root of the number of pixels.
At extremely high binning settings, sensitivity might depend on the signal intensity and size of the feature being imaged. If the bin contains more pixels than the feature (for example, a band on a blot), the intensity is averaged over the entire binned area. In some images, this might render the feature not visible above the background.
Dynamic and Linear Range in Western Blot Imaging
| Binning | 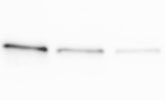 1x1 (none) | 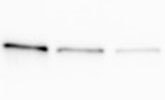 2x2 |  4x4 |  8x8 |
|---|---|---|---|---|
| Relative area | 1 | 4 | 16 | 64 |
| Relative exposure time | 64 seconds | 16 seconds | 4 seconds | 1 seconds |
| Relative read noise (CCD) | 1 | 1 | 1 | 1 |
| Relative read noise (CMOS) | 1 | 2 | 4 | 8 |
| Relative dark noise | 1 | 2 | 4 | 8 |
For western blotting imaging systems, binning is often used to increase the sensitivity of a camera and reduce image acquisition time but at the cost of lower resolution of the resulting image.
For CCD sensors, there is a read noise advantage when binning because each binned super pixel is read only once. Since the signal is an accumulation from all the individual pixels that go into the binned super pixel, but the read noise is from a single read event, the read noise component of the signal to noise ratio is improved.
For CMOS sensors, each pixel is still read individually even when binned, but there is still a noise advantage because the noise scales with the square root of the number of pixels in the bin.
The dark current value scales linearly with the number of pixels (each bit of silicon is susceptible to thermal energy whether or not it is part of a binned pixel), but the dark noise scales with the square root of the number of pixels that are in the bin.
Dynamic and Linear Range in Western Blot Imaging
Signal Accumulation Mode on a ChemiDoc Imaging System for Western Blotting
Many researchers desire to analyze both low and high expressing proteins in a sample on the same western blot. This poses a challenge during the imaging step because the long exposure times that allow detection of the low expressing protein result in saturated or “blown-out” bands of the abundant protein. Conversely, short exposure times that are appropriate for strongly expressed proteins may be too short for low abundance proteins, and their signal may be missed.
- Saturation is the point at which the sensor pixels can no longer convert additional incoming photons to electrons. Imaging software will identify these pixels and usually display them in a different color.
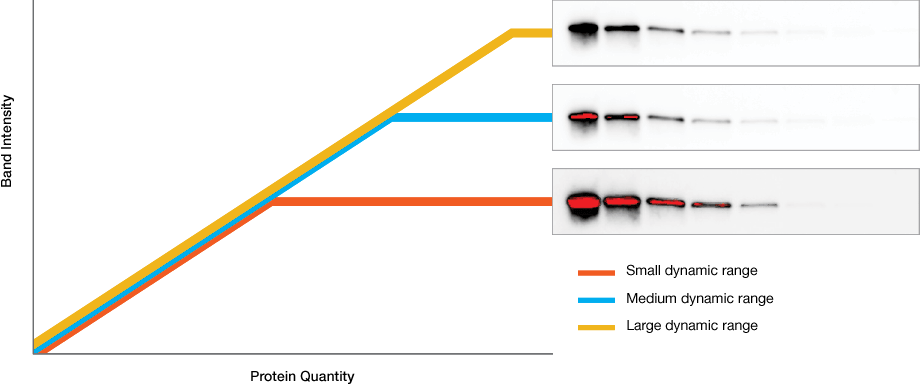
Dynamic range is the ratio of signal strengths from weakest to strongest that the imaging system can capture in a single image. Understanding imaging dynamic range is critical for properly analyzing your data and interpreting your western blotting results.
Intrascene Dynamic Range
Instruments with limited dynamic ranges lead to strong bands that become saturated with exposure times that are necessary for weaker ones. Instruments with wide dynamic ranges allow image capture of bands with both low and high intensity, allowing analysis of proteins that are both weakly and strongly expressed.
Extended Dynamic Range Imaging
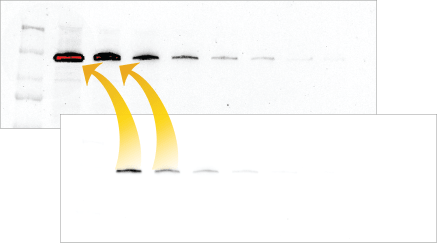
Some blots contain both very faint and very intense bands that cannot be captured with a single exposure.
To overcome this challenge, Bio-Rad western blot imagers, like the ChemiDoc systems, use extended dynamic range imaging that help capture these kinds of blots to maximize sensitivity without saturation.
1
First, two images of different exposure times are taken. A long exposure image that captures the lowest expressing protein but may result in saturation of strong bands. A short exposure image is taken that avoids saturation of the high-expressing protein but may miss low-abundance proteins.
2
The Image Lab Touch Software algorithm then replaces the saturated pixels in the long exposure image with pixels from the same location from the the short exposure image. To preserve the intensity values of those pixels, the algorithm mathematically scales the intensity based on the exposure time differences. The resulting merged image is beyond a 16-bit data depth, so this mathematical calculation is performed in floating point space and then re-scaled to 16 bits.

3
The final image includes both the faint signal (from the long exposure) and strong signal (from the short exposure). This result is an extended dynamic range image without saturation and is fully quantifiable.
Learn More about Our ChemiDoc Imaging Systems »
Linear Range
For western blot analysis, accurate quantitation requires the signal from the protein bands to be within the linear range of the imaging system. Within the linear range, the relationship between band intensity as recorded by the imager and protein quantity have a linear and proportional relationship. Signal outside the linear range can be affected by noise if the signal is weak or, if the signal is too strong, then the imaging system can no longer accurately record increasing signal intensity (saturation).
Tip
Bio-Rad offers fluorescent antibodies against common housekeeping proteins that have been tuned to yield a linear response across typical sample loading amounts.
Explore Our hFAB Fluorescent Housekeeping Protein Antibodies »
In western blotting, saturation may occur for several reasons. With high-sample loads, the membrane binding capacity may be exceeded. With traditional film detection, the photoreactive silver grains on the X-ray film may have already been activated and additional light in that region cannot be captured. With digital imagers, CCD and CMOS sensors also have a limit to the amount of photons that they can capture (called pixel well depth). Imaging software typically displays saturated pixels in a different color. For example, Image Lab Software displays these pixels in red. Note that saturation by other means like exceeding the binding capacity of the membrane, will not be detected by the software.
For the most accurate western blotting quantitation, loading controls are often used to normalize for differences in sample load. It is important to ensure that the target protein and the loading control are both within their linear ranges for the loaded quantity. Validate your loading control at the loaded amounts necessary for your target protein. You may need to optimize loading amounts, antibody concentration, or select a different loading control. Many commonly used loading controls such as GAPDH or actin are highly expressed and saturate even with low-loading amounts.
Only data within the linear range will be quantifiable. Weak signal can be affected by noise, making measurement inaccurate while signal that is saturated also cannot be accurately measured as increasing sample load will not be reflected by an increase in captured signal.

Mismatched dynamic range

Target protein and loading control well matched
For accurate data normalization to a loading control, both the target protein and the loading control must be within their linear dynamic ranges. If either one is outside the linear range, then quantitation will be inaccurate.
Bit depth
2 Bits

4 Bits

8 Bits

16 Bits

Examples of pixel intensity encoded at 2, 4, 8, or 16 bits.
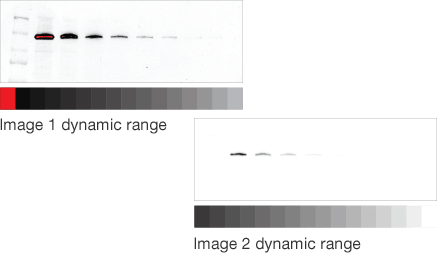
When a western blot image is captured, it must be digitized to convert the continuous tone intensity of the blot into digital data that encodes the intensity levels of each pixel. The accuracy of this digital data is directly proportional to the bit depth of the imaging system.
For example, if two bits are used for each pixel, the intensity can be represented by four values or levels (2 x 2). If three bits are used, then the image can have eight intensity levels (2 x 2 x 2). For many modern imaging systems, 16 bits of data are used to encode intensity, which corresponds to 65,536 levels (216). Note that most systems assign black to 0, so the highest numerical intensity value is actually 65,535.
While related concepts, bit depth and dynamic range are two distinct ideas that are frequently confused. Bit depth describes how accurately a value can be represented digitally, so greater bit depth yields more accurate digitization of the intensities on a blot, but greater bit depth does not necessarily imply that an imager is capable of greater dynamic range. A staircase makes a useful analogy: dynamic range is the height of the staircase, and bit depth is the number of steps in the staircase. You can have a high or low staircase (dynamic range), and the number of steps in the staircase can vary independent of the height (bit depth). A greater bit depth will allow smoother transitions between intensity levels so it may produce a better looking image. However, modern 16 bit cameras have more than sufficient bit depth so dynamic range is usually the limiting factor.

Limited dynamic range and bit depth

Limited dynamic range but increased bit depth

Wide dynamic range but limited bit depth
Fluorescent Western Blot Detection
Fluorescent western blots are becoming increasingly more popular because of their advantages with multiplex detection. Fluorescent detection differs from chemiluminescence in that light is generated from excitation of a fluorescent molecule conjugated to the detection antibody, not an enzymatic reaction.
The fluorophore is excited by this light and emits light at a longer wavelength. The imaging system blocks the excitation light from entering the camera by using wavelength-specific optical filters that only permit desired emitted light of the right wavelength to pass. This wavelength-specificity allows the imager to distinguish excitation light from the emitted light and further, allows differentiation between different protein targets, provided that the fluorophores conjugated to the secondary antibodies are spectrally distinct.
Advantages of Fluorescent Detection:
- Greater linear range. Chemiluminescence is dependent on enzyme substrate kinetics that limit linear range
- Multiplex detection. Different protein targets can be detected with different fluorophores with distinct excitation and/or emission spectra.
- Blots can be archived for several months
Disadvantages of Fluorescent Detection:
- Imaging systems with illumination sources and emission filters tend to be more costly
- Sensitivity has historically been lower than chemiluminescence, but new fluorophores match chemiluminescence
Considerations for Fluorescent Western Blotting
Fluorescent imaging requires consideration of several factors to take advantage of the benefits of fluorescent detection and to optimize sensitivity and data quality.
Fluorophore and Filter Spectra
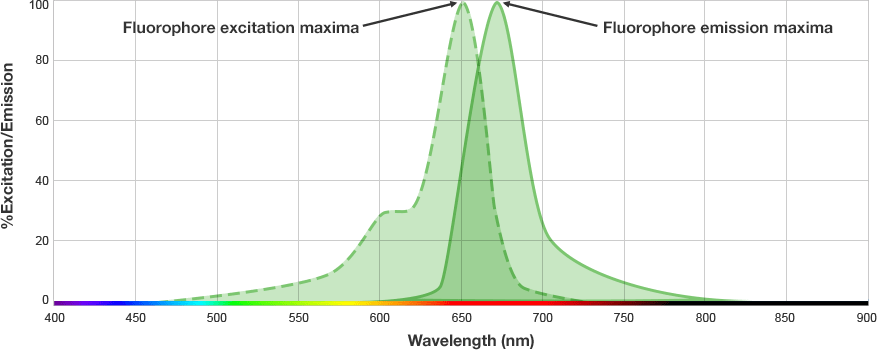
Fluorophore spectra
Many antibody suppliers provide excitation and emission spectra for the fluorophores conjugated to their antibodies.
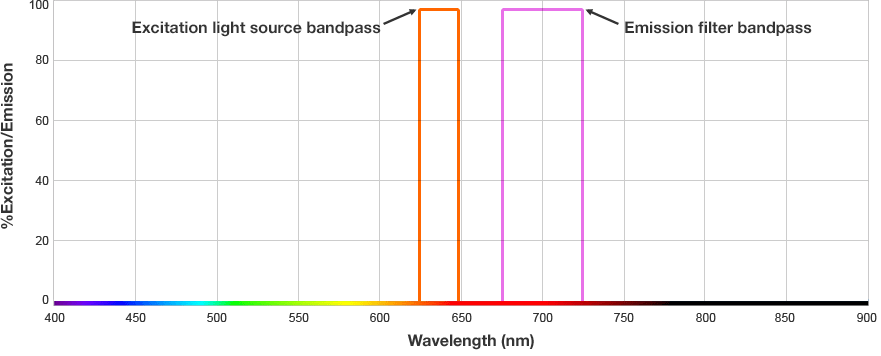
Filter bandpass
The optical filters in western blotting imagers are designed to restrict all light from passing except through a carefully selected range of wavelengths, called the "bandpass."
Filters are typically specified by the wavelength at the center of the bandpass and the width of the passing window, in nanometers. In this example, the excitation filter is "637/25", meaning the bandpass is centered at 637 nm and allows light from 624–649 nm to pass.
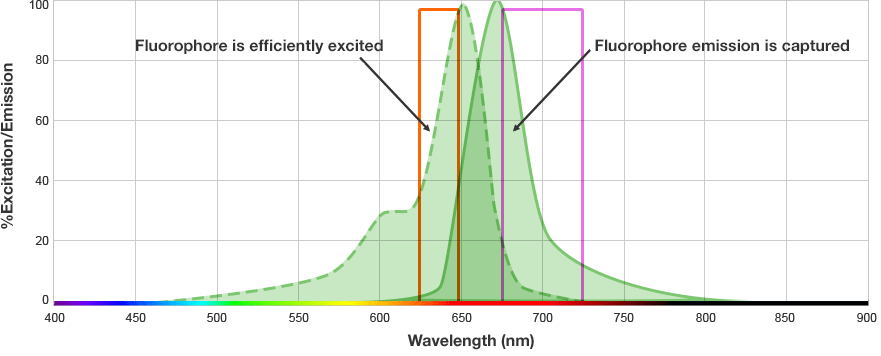
Optimal spectral match
The excitation and emission spectra of the fluorophore must match the band passes of the filters of your instrument.
The excitation maxima for this fluorophore matches the excitation wavelengths of the imaging instrument well. Likewise, the bandpass for the emission filter captures the vast majority of the emitted light for this flurophore.
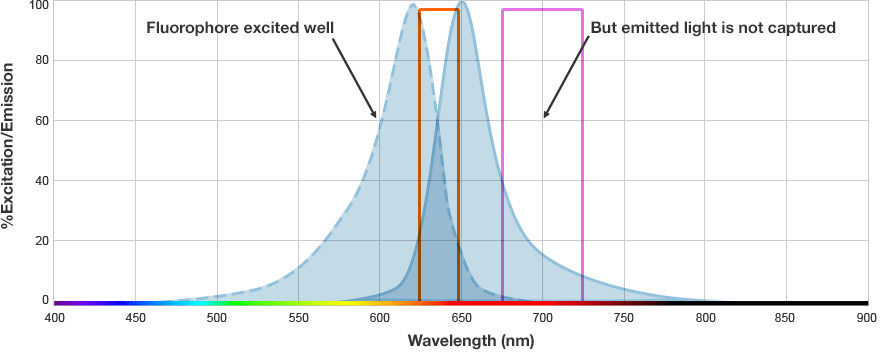
Poor spectral match
This fluorophore would be a poor choice for your instrument since the emission spectra does not overlap very much with the emission filter bandpass. Most of the emitted light from the fluorophore will be lost.
Learn More about Fluorescent Western Blotting »
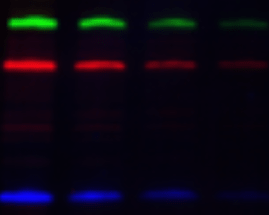
Multiplexing Fluorescent Western Blotting
One of the major advantages of fluorescent detection is the ability to image multiple protein targets on a single blot. Multiplexing relies on the ability to distinguish signals from multiple proteins, both immunologically as well as spectrally. In order to successfully perform a multiplex western blot, there are several considerations to keep in mind.
Immunologically, the primary antibodies must be specific to only the proteins that they were raised against and must be from different host species for each target. The primary antibodies should ideally be from distantly related species to avoid possible cross-reactivity. For example, use mouse and rabbit to detect two targets and avoid combinations like mouse and rat.
The signals from multiple target proteins are also distinguished spectrally. This means that the fluorophores conjugated to the secondary antibodies have different excitation and/or emission spectra so the proper combination of optical filters can be used to distinguish between emitted light from each secondary antibody.
Fluorophore Selection for Multiplexing

Compatible multiplexing
When designing a multiplex experiment, select fluorophores with distinct spectra to minimize cross-talk. These two fluorophores have non-overlapping emission spectra so can be easily discriminated by the emission band pass filters.
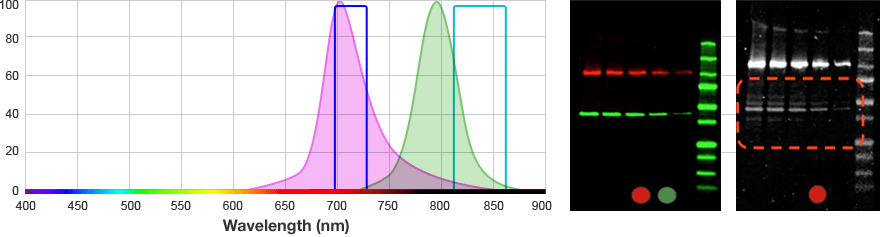
Incompatible for multiplexing
These fluorophores would be a poor choice for multiplexing. Their signifcant overlapping emission spectra with significant emission within the bandpass of the other fluorophore leads to bleed-over between channels.
| Imaging System Channel | Excitation Filter Bandpass (nm) | Emission Filter Bandpass (nm) | Example Compatible Fluorophore |
|---|---|---|---|
| Blue | 460–490 | 518–546 | Alexa 488 DyLight 488 |
| Green | 520–545 | 577–627 | Rhodamine Alexa 546 DyLight 550 |
| Red | 625–650 | 675–725 | Alexa 647 DyLight 649 |
| Far Red | 650–675 | 700–730 | Alexa 680 DyLight 680 IRDye 700DX |
| Near Infra-Red (IR) | 755–777 | 813–860 | Alexa 790 DyLight 800 IRDye 800CW |
| Blue nanoparticle polymer | 460–490 | 518–546 | StarBright 520 |
| Near IR nanoparticle polymer | 460–490 | 813–860 | StarBright 700 |
Example excitation and emission wavelength bandpass filters from Bio-Rad's ChemiDoc MP Imaging System.
Recommended Fluorophore Combinations for Multiplex Detection:
| Targets | Primary Target (Fluorophore A) | Second Target (Fluorophore B) | Third Target (Fluorophore C) |
|---|---|---|---|
| 1 | StarBright Blue 700 | — | — |
| 2 | StarBright Blue 700 | hFAB Rhodamine HKP* Antibody (α-actin/tubulin/GAPDH) | — |
| 3 | StarBright Blue 700 | StarBright Blue 520 | hFAB Rhodamine HKP Antibody (α-actin/tubulin/GAPDH) |
See Our Selection of Fluorescent Western Blotting Antibodies »
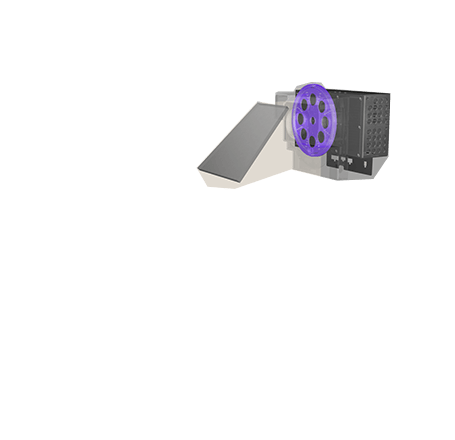
Western Blot Imaging Instrumentation
Each component of a digital imaging system contributes to the performance and data quality of the entire system. The optical components such as the lens and filters, electronic components of the camera, and illumination sources all play a role in the overall performance of the imaging system. In this section, we give an overview of a typical modern western blot imaging system to highlight some of their characteristics that lead to signal sensitivity or image noise and background.
Imaging System Design
On this page, you have learned about the concepts behind imaging western blots. Engineers and scientists work to design an imaging system to maximize instrument sensitivity, reduce background, make the data quantifiable.
Some imaging systems may have a single, highly-specialized component that may appear to make the instrument extremely sensitive, but all components of an imaging system must work together or it will be limited by the weakest performing component. For example, cameras with high megapixel sensors may not yield better images if the lens or other parts of the system do not match its performance.
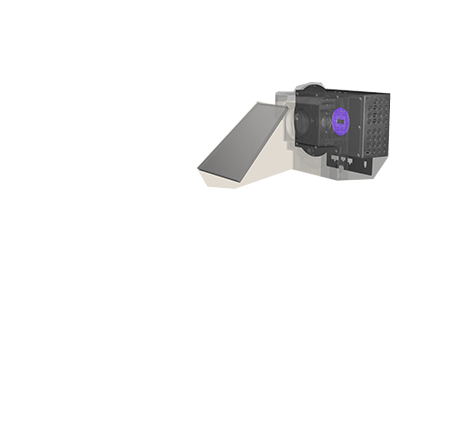
Important Imaging System Features
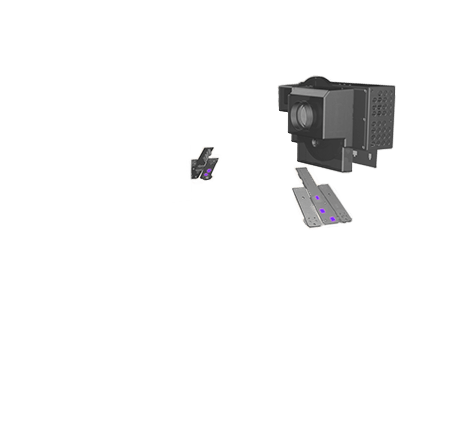
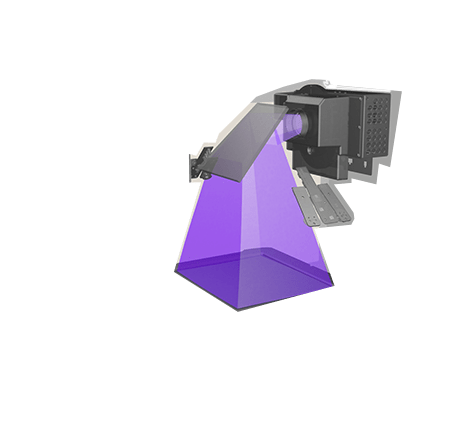
Epi light sources
For fluorescent western blots, the blot must be illuminated by a light source. The light source is usually an LED that outputs a narrow range of wavelengths that is further refined by the emission filters. The emission filters must be designed to allow the correct wavelengths of light to pass while simultaneously blocking undesired wavelengths. The lights must also be positioned and designed to provide even illumination to the sample, to prevent dark or light areas that could affect band quantitation.
Chemi Blot
For chemiluminescent blots, since the blot itself generates light, there is no need for a light source. The light from the blot is captured by the lens and camera of the imaging system.
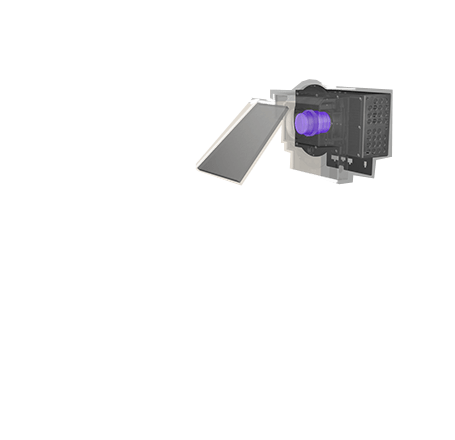
Lens
Light from the blot is captured by the lens, which must be designed to capture as much light as possible in order to maximize sensitivity, without introducing distortion to the image. Moreover, interior materials and coatings must be designed to control internal reflections to avoid introducing background haze or glow to images.
Emission filters
For fluorescent western blots, emitted light from the fluorophores conjugated to secondary antibodies is intermixed with the excitation light and background light from the membrane. Emission filters are designed with appropriate bandpasses to both admit desired wavelengths emitted by the secondary antibodies as well as reject the excitation light to eliminate unwanted background.
Camera and sensor
The camera and sensor record the light admitted by the lens and filters. The sensor and supporting camera electonics must be optimized for maximum sensitivity while also minimizing electronics noise such as read noise and dark current.
With optimized system design, all components of an imaging system work together to capture blot data so you can analyze even low-abundance, protein-expression levels with confidence.
Tips for Better Western Blot Imaging
Turn on your imager's "show saturated pixels" option. This helps you avoid excessively long exposure times that lead to saturated bands and non-quantifiable data.

Give your imaging system's auto-exposure algorithms the first shot at an image. Most are sophisticated enough to fill the dynamic range of the sensor while still avoiding pixel saturation. This gives the most accurate, quantifiable data possible.
For multiplex fluorescent westerns, reserve your long wavelengths for low-abundance proteins since membrane background is lowest and sensitivity is greatest with longer wavelengths.
Molecular weight standards are often very intense, causing auto-exposure algorithms to take exposures too short for your proteins of interest. If this is the case, manually enter a longer exposure time. Alternatively, use your imager's "region-of-interest" feature to specify the area of the blot to apply the auto exposure algorithm. In both cases, the standards will be saturated but this is inconsequential because they are not used to calculate quantity.
How to get the best possible data using the ChemiDoc Instrument
Auto-Exposure Settings for Western Blot Imaging in Image Lab Touch Software
Targeting Area of Interest for Auto Exposure in Image Lab Touch Software
Western Blot Imaging Protocols and Resources

Find the right products for you using the free Western Blot Selector Tool

Western Blotting Protocol Library
Filter by your laboratory set-up and reagents to get a custom western blotting protocol that best fits your needs.

Improving Digital Imaging for Quantitative Western Blotting
Learn about the design principles behind designing a high-performance western blot imaging system.

Film vs. Digital Western Blot Imaging
Learn about the advantages of digital imaging over traditional film.

Fundamentals of Western Blotting Course #4: Image Acquisition

Get Your Free Protein Standard Temporary Tattoo
You too can sport a Precision Plus Protein Kaleidoscope standard tatto temporarily.

Better Western Blotting Guide
Tips, Techniques, and Technologies from the Western Blotting Experts at Bio-Rad Laboratories

Western Blot University
Courses designed to make you a western blotting expert.