


LOB/LOD Calculator
Use the tool below to calculate the LOB and the LOD of a ddPCR assay adapted from the Clinical and Laboratory Standards Institute (CLSI) EP17-A2 standard (Protocols for Determination of Limits of Detection and Limits of Quantitation; Approved Guideline).1 See example
Upload your data file
Use the excel template to ensure proper formatting.
How to Calculate the LOB
Definition
The LOB with a confidence level (1 − α) is defined as the maximum concentration expected in a well with a probability of 1 − α in a sample containing no target sequence. In other words, it is the highest concentration plausible with a 1 − α probability (typically 95% for α = 5%).
The sample used to calculate the LOB, known as a negative control or blank sample, in most cases contains no sequence for a given target. However, the blank sample should represent the nature of the samples. For example, if testing circulating tumor (ctDNA) extracted from plasma or FFPE DNA, the blank sample should contain no mutant sequences but include a background of fragmented wild-type DNA, such as ctDNA extracted from a wild-type plasma sample.
Calculation Method
- Run your ddPCR workflow with a minimum of N ≥ 30 negative control replicates. This is required to reach the standard 95% confidence level. (For 99%, use N ≥ 60 negative control replicates, etc.)
- When you export your chamber concentration results (copies/µL) using the provided template and upload them to the tool, the tool automatically orders the values in ascending concentration order (1 to N) for each target.
- The tool calculates PLOB, the probability of a true negative, as 1 − α (for example, if α = 0.05, PLOB = 1 − α = 0.95). It then identifies the rank position X corresponding to this PLOB, where X = 0.5 + (N × PLOB).
- To determine the LOB, the tool identifies the ranks flanking X and their corresponding concentrations (C1 and C2), then interpolates between them:
LOB = C1 + Y × (C2 − C1)
C1 = concentration for rank X1 (X1 = rank below rank X)
C2 = concentration for rank X2 (X2 = Rank above rank X)
Y = 0.Z, where Z corresponds to the digit after the decimal point of X (for example, if X = 40.4, Y = 0.4; if X = 38.0, Y = 0)
If Y = 0, X1 = X and LOB = C1 (concentration for rank X)
How to Calculate the LOD
Definition
The LOD with a confidence level (1 − β) is defined as the minimum concentration at which the target sequence can be detected in a well with a probability of 1 − β. In other words, it is the lowest concentration that can be considered nonzero and greater than the LOB with a 1 − β probability (typically 95% for β = 5%).
Calculation Method
- Carry out the ddPCR workflow on a minimum of five independently prepared low-level (LL) samples (LL1–LL5), performing at least six replicates per sample. The LL samples used to calculate the LOD should be representative positive samples or a representative sample matrix with spiked-in target concentrations within a range of one to five times higher than the calculated LOB.
- Determine the standard deviation (SDi) for each group of replicates (SDi1–SDi5). The quantification variability between LL samples should not be significantly different. The significance of this difference should be checked using a statistical method (Cochran’s test, for example).2 A significant difference in quantification variability between LL samples suggests either an instability of the reaction or a concentration range too large for the selected LL samples (in which case, repeat the study with more appropriate samples).
Calculate the global SD (SDL).
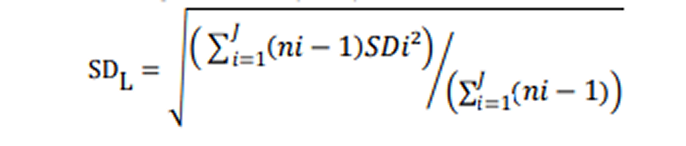
SDi = standard deviation of all results for the ith low-level sample
ni = the number of results for the ith low level sample
J = number of LL samplesNote that if all the LL samples contain the same number of replicates, SDL can be calculated with the following formula:

- Calculate Cp = coefficient to give the 95th percentile of a normal distribution.
L = total of samples (J x n replicates, n ≥ 6)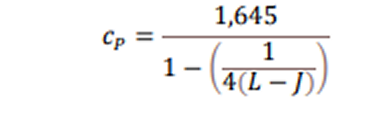
The value 1.645 represents the 95th percentile from the normal distribution for α = 0.05. If a different α value is chosen, this multiplier will need to change accordingly.
LOD = LOB + Cp x SDL
Interpreting LOB and LOD Values
This tool is intended to provide statistical calculations only and is not intended to be used as a standalone diagnostic result. Interpretation of sample results should be based on your laboratory's validated methods, procedures, and applicable regulatory requirements.
The LOB and LOD values can be interpreted as follows:
| Target X Concentration (C[X]) | Statistical Interpretation |
|---|---|
| C[X] ≤ LOB | Target not detected above background |
| LOB < C[X] < LOD | Target detected but below the assay's quantification threshold; consider rerunning with additional sample volume |
| C[X] ≥ LOD | Target detected and above the assay's quantification threshold |
This tool provides a statistical calculation only. Interpretation of individual sample results should follow your laboratory's validated procedures.
References
- Clinical and Laboratory Standards Institute (2012). Evaluation of detection capability for clinical laboratory measurement procedures; approved guideline, 2nd ed. CLSI document EP17-A2.
- Cochran WG (1941). The distribution of the largest of a set of estimated variances as a fraction of their total. Ann Eugenics 11, 47–52.