
Listed below are some common symptoms in a gene expression/quantification experiment. Select one of the symptoms to view possible causes and solutions.
Related Topics: What Is Real-Time PCR?, How Real-Time PCR Works, PCR Assay Design and Optimization, Allelic Discrimination Experiments, and High Resolution Melt (HRM) Experiments.
Symptoms

Poor Signal or No Signal
Back to TopPoor signal or no signal in your reaction well(s) may be due to the causes below. Select one of the causes for possible solutions.
- Inhibitor Present
- Non-Optimized Buffer Composition
- Non-Optimized Thermal Cycling Conditions
- Degraded Template Material
- Probe Quality Issues
Inhibitor Present
Back to Top|
Sometimes inhibitors of PCR are carried over from sample preparation (nucleic acid extraction). Common PCR inhibitors include phenol, detergents, proteases, and residual compounds from source materials, such as animal or plant tissue, bodily fluids, or soil preparations. Suboptimal reactions containing inhibitors are highly likely to have poor reproducibility. |
|
| Possible Solutions | Perform a dilution series of the PCR template to determine whether the effect of the inhibitory agent can be reduced. |
| Take extra care with the nucleic acid extraction steps to minimize carryover of PCR inhibitors. | |
Recommended Products and Links
Non-Optimized Buffer Composition
Back to Top|
SYBR® Green-based real-time PCR assays require relatively high concentrations of reaction buffer components, such as MgCl2, for efficient amplification. |
|
| Possible Solutions | For optimal results, use at least 3 mM MgCl2 or use a real-time PCR supermix. Optimal conditions can vary with assay type. Therefore, when establishing a new assay, start with the following concentrations of buffer components and adjust as necessary:
|
Recommended Products and Links
- SsoAdvanced™ Universal SYBR® Green Supermix
- SsoAdvanced™ Universal Probes Supermix
- iQ™ Multiplex Powermix
- iScript™ Advanced cDNA Synthesis Kit for RT-qPCR
- iTaq™ Universal SYBR® Green One-Step Kit for RT-qPCR
- iTaq™ Universal Probes One-Step Kit for RT-qPCR
Non-Optimized Thermal Cycling Conditions
Back to Top|
Adequate time must be spent at the denaturation, annealing, and extension steps of a thermal cycling protocol to ensure efficient amplification. Insufficient incubation times will not allow complete replication of template, and can result in a lack of amplification signal. |
|
| Possible Solution | Try using a minimum extension time of 30 sec for genomic DNA and 15 sec for cDNA. |
Degraded Template Material
Back to Top|
Degraded or sheared nucleic acid template might result in poor amplification signal. Degradation can occur during sample preparation or template storage. Long-term storage of nucleic acid templates in dilute solutions can contribute to template degradation. |
|
| Possible Solutions | Do not store diluted template in water or at low concentrations. |
| Check the integrity of template material by automated or manual gel electrophoresis. | |
| Use freshly prepared nucleic acid to ensure the availability of intact template sequence for efficient amplification. | |
Recommended Products and Links
- DNA Isolation
- RNA Isolation
- iScript™ Advanced cDNA Synthesis Kit for RT-qPCR
- Aurum™ Total RNA Kits
- PureZOL™ RNA Isolation Reagent
- iScript™ cDNA Synthesis Kit
- Experion™ Automated Electrophoresis System and Reagents
|
Fluorescent hybridization probes may become partially degraded if a probe is subjected to multiple freeze-thaw cycles or long-term storage at temperatures above –20°C. Under these conditions, bonds between the oligonucleotide probe and the conjugated fluorophore become labile. The use of partially degraded or unstable probes results in inefficient fluorophore quenching during real-time PCR, contributing to a high background signal or a gradual increase in baseline fluorescence during thermal cycling. |
|
| Possible Solutions | Do not store diluted probes in water or at low concentrations. |
| Do not store hybridization probes at temperatures above –20°C. | |
| Check with the oligonucleotide manufacturer for the recommended dilution and storage conditions for the hybridization probe. | |
| Aliquot probe stock into small volumes and thaw each aliquot only once. | |
Signal in Negative Control
Back to TopSignals in negative controls may be due to the causes below. Select one of the causes for possible solutions.
- Contamination of Reaction Components with Target Sequence
- Primer-Dimer Formation
- Amplification of Genomic DNA (in RT-qPCR experiments)
Contamination of Reaction Components with Target Sequence
Back to Top|
Poor laboratory technique can result in contamination of PCR samples. Contamination will be evidenced by the presence of an amplification signal in negative control samples prepared with all reaction components except the DNA template, referred to as a "no-template" or "primer-only" control. |
|
| Possible Solutions | To minimize the possibility of contamination of PCR components by PCR product or other template, designate a work area exclusively for PCR assay setup. |
| Use a solution of 10% bleach instead of ethanol to prepare the workstation area for PCR assay setup. Ethanol will only induce precipitation of DNA in your work area, while the 10% bleach solution will hydrolyze, as well as dissolve, any residual DNA. | |
In general, follow these practices to minimize the risk of sample contamination:
|
|
Recommended Products and Links
Primer-Dimer Formation
Back to Top|
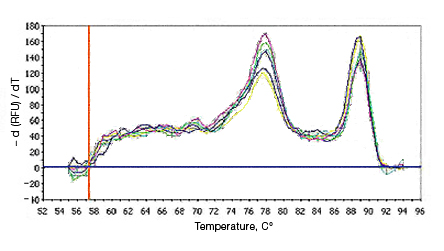
Primer-dimers may be the result of poor primer design or high primer concentrations. Example Data: Primer-Dimer Melt Curve
|
|
| Possible Solutions | Reduce primer concentration. |
| Evaluate primer sequences for complementarity and secondary structure. Redesign primers if necessary. | |
| Perform melt-curve analysis to determine if primer-dimers are present. | |
Amplification of Genomic DNA (in RT-qPCR experiments)
Back to Top|
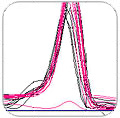
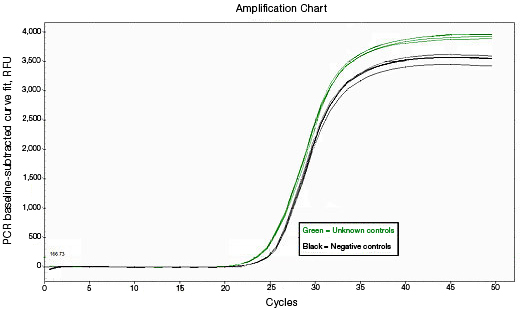
RNA used for reverse transcription (RT)-qPCR must be free of genomic DNA contamination. If the PCR primers for the cDNA template are able to anneal to the genomic copy of the same gene, an amplification signal may be observed in the no-RT controls. If SYBR® Green I is used, perform a melt-curve analysis. Amplified genomic DNA product will have a Tm similar to that of the expected cDNA product. Example Data: No-RT control samples are represented in black in images below.
|
|
| Possible Solutions | Treat samples with purified RNase-free DNase before reverse transcription. |
| It may also be helpful to design primers at splice junctions to avoid genomic DNA amplification. | |
Recommended Products and Links
- DNA Isolation
- RNA Isolation
- iScript™ Advanced cDNA Synthesis Kit for RT-qPCR
- Aurum™ Total RNA Kits
- PureZOL™ RNA Isolation Reagent
Poor Reproducibility across Replicate Samples
Back to Top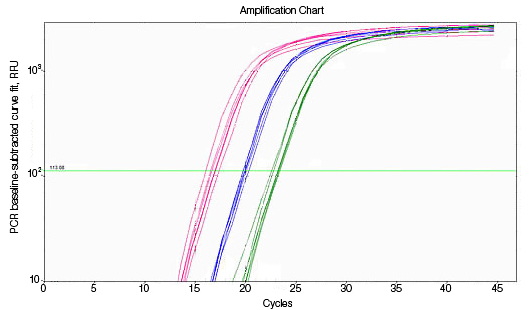
Pipetting
Back to Top|
CT values of replicates can show increased variation due to poor laboratory technique or imprecise pipets. |
|
| Possible Solutions | In general, follow these practices to improve replicate reproducibility:
|
Recommended Products and Links
- SsoAdvanced™ Universal SYBR® Green Supermix
- SsoFast™ EvaGreen® Supermixes
- iQ™ SYBR® Green Supermix
- iQ™ Supermix
Inhibitor Present
Back to Top|
Sometimes inhibitors of PCR are carried over from sample preparation (nucleic acid extraction). Common PCR inhibitors include phenol, detergents, proteases, and residual compounds from source materials, such as animal or plant tissue, bodily fluids, or soil preparations. Suboptimal reactions containing inhibitors are highly likely to have poor reproducibility. |
|
| Possible Solutions | Perform a dilution series of the PCR template to determine whether the effect of the inhibitory agent can be reduced. |
| Take extra care with the nucleic acid extraction steps to minimize carryover of PCR inhibitors. | |
Recommended Products and Links
Primer Design
Back to Top|
Some primers are particularly sensitive to thermal cycling conditions, leading to poor reproducibility in amplification reactions. |
|
| Possible Solution | Verify how your primers behave at different annealing temperatures by using a Temperature Gradient. |
Pipetting
Back to Top|
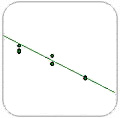
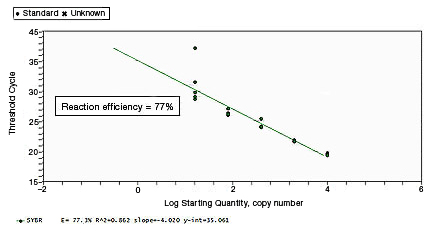
CT values of replicates can show increased variation due to poor laboratory technique or imprecise pipets. This can skew the standard curve, leading to the observation of either low or high reaction efficiency, depending on the type of pipetting error. |
|
| Possible Solutions | In general, follow these practices to improve replicate reproducibility:
|
Recommended Products and Links
- SsoAdvanced™ Universal SYBR® Green Supermix
- SsoFast™ EvaGreen® Supermixes
- iQ™ SYBR® Green Supermix
- iQ™ Supermix
Primer-Dimer Formation
Back to Top|
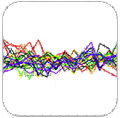
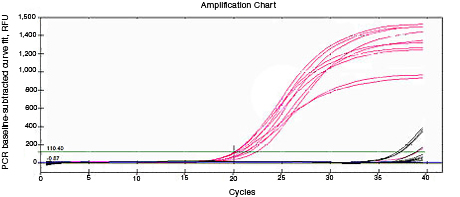
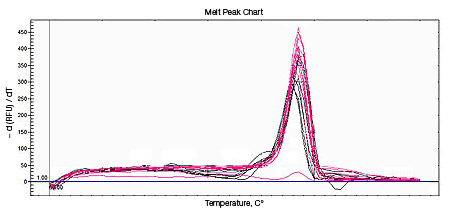
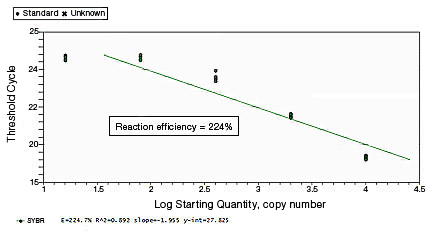
In a SYBR® Green assay, the additional fluorescent signal produced by accumulating primer-dimers can skew the standard curve and lead to artificially high reaction efficiencies. Primer-dimers can be the result of poor primer design or high primer concentrations. Example Data: Primer-Dimer Formation
Example Data: Primer-Dimer Melt Curve
|
|
| Possible Solutions | Reduce primer concentration. |
| Evaluate primer sequences for complementarity and secondary structure. Redesign primers if necessary. | |
| Perform melt-curve analysis to determine if primer-dimers are present. | |
Probe Quality
Back to Top|
Fluorescent hybridization probes may become partially degraded when subjected to multiple freeze-thaw cycles or long-term storage at temperatures above –20°C. Under these conditions, bonds between the oligonucleotide probe and the conjugated fluorophore become labile. The use of partially degraded or unstable probes results in inefficient fluorophore quenching during real-time PCR, contributing to extraneous fluorescent signal, which may impact CT values, skew the resulting standard curve, and introduce errors into efficiency calculations. |
|
| Possible Solutions | Do not store diluted probes in water or at low concentrations. |
| Do not store hybridization probes at temperatures above –20°C. | |
| Check with the oligonucleotide manufacturer for the recommended dilution and storage conditions for the hybridization probe. | |
| Aliquot probe stock into small volumes and thaw each aliquot only once. | |
Assay Design
Back to Top|
In some cases, the PCR target may be too long or may contain too much secondary structure to allow efficient amplification by real-time PCR. |
|
| Possible Solutions | Real-time PCR is most efficient when the PCR product is less than 150 bp in length. Select a target sequence with fewer than 150 bp for optimal results. |
Significant secondary structure in the PCR template may hinder primer annealing and prevent complete product extension by the polymerase. Follow these guidelines when selecting a target sequence:
|
|
| For multiplex assays, use iQ Multiplex Powermix or follow the guidelines in Multiplex Assay Validation and Optimization. | |
Recommended Products and Links
Insufficient Optimization
Back to Top|
Proper assay optimization is essential to the achievement of high-quality results. Nonoptimal assays are highly likely to produce nonspecific products, or insufficient product, resulting in an unexpected shift in PCR amplification efficiency. |
|
| Possible Solutions | Optimal conditions can vary with assay type. Therefore, when establishing a new assay, start with the following concentrations of buffer components and adjust as necessary:
|
| Use a preoptimized reagent mix to ensure consistent PCR results | |
| Use a thermal gradient to identify the optimal thermal cycling conditions for a specific primer set | |
Recommended Products and Links
- SsoAdvanced™ Universal SYBR® Green Supermix
- SsoFast™ EvaGreen® Supermixes
- iQ™ SYBR® Green Supermix
- iQ™ Supermix
Further Reading
![]()
Guo L et al. (2010). Gene expression profiling of drug-resistant small cell lung cancer cells by combining microRNA and cDNA expression analysis. Eur J Cancer 46, 1692–1702. PMID: 20371173
Hu CJ et al. (2006). Differential regulation of the transcriptional activities of hypoxia-inducible factor 1 alpha (HIF-1alpha) and HIF-2alpha in stem cells. Mol Cell Biol 26, 3514–3526. PMID: 16611993
Hu T et al. (2010). Xenobiotic metabolism gene expression in the EpiDermin vitro 3D human epidermis model compared to human skin. Toxicol In Vitro 24, 1450–1463. PMID: 20350595
Jung SG et al. (2010). Prognostic significance of Notch 3 gene expression in ovarian serous carcinoma. Cancer Sci 101, 1977–1983. PMID: 20624166
Li Y et al. (2006). DAPK1 variants are associated with Alzheimer's disease and allele-specific expression. Hum Mol Genet 15, 2560–2568. PMID: 16847012
Pizzimenti S et al. (2009). MicroRNA expression changes during human leukemic HL-60 cell differentiation induced by 4-hydroxynonenal, a product of lipid peroxidation. Free Radic Biol Med 46, 282–288. PMID: 19022373
Ridd K et al. (2006). Association of gene expression with sequential proliferation, differentiation and tumor formation in murine skin. Carcinogenesis 27, 1556–1566. PMID: 16537558
Yi J et al. (2010). A single-repeat MYB transcription factor, GmMYB176, regulates CHS8 gene expression and affects isoflavonoid biosynthesis in soybean. Plant J 62, 1019–1034. PMID: 20345602

