

Flow cytometry is the measurement of the physical and chemical properties of cells (or particles) suspended in an aqueous liquid. It can be used for a wide variety of applications including immunophenotyping, exosome analysis, cancer research and screening, and often utilizes fluorescently labelled antibodies. All these applications can be performed using a flow cytometer. In this article we explain how this cutting-edge scientific instrument turns particles into valuable, usable data.
A flow cytometer has three main components:
Fluidics System
The purpose of the fluidics system is to deliver cells one by one to the interrogation point (this is the point at which the laser beam intersects with the stream of cells). Each cell is measured individually and sequentially meaning that cells must be forced to pass, in single file, through the interrogation point.
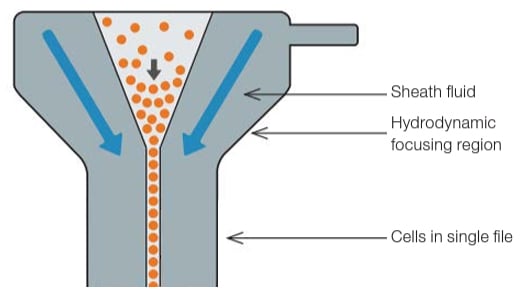
Figure 1. A representation of hydrodynamic focusing in the flow cell.
When the sample enters the flow cytometer, the particles are randomly distributed in the 3-D space of the sample line, the diameter of which is significantly larger than the diameter of most cells. Hydrodynamic focusing is used to narrow the diameter of the stream of particles. This is done by pumping the sample into the center of a channel (or flow cell) at the same time as a much larger volume of additional fluid (referred to as sheath fluid). Because the sample is flowing at a much lower rate, it occupies a smaller proportion of the channel. Under optimal conditions (laminar flow), there is no mixing of the sample fluid stream and the sheath fluid (Figure 1).
Sample Interrogation
After hydrodynamic focusing, each particle passes through one or more laser beams of focused light with each light source having a single wavelength ranging from ultraviolet to far red. Light scattering or fluorescence emission (from autofluorescence or if the particle is labeled with a fluorophore) provides information about the particle's properties. Light that is scattered in the forward direction after interacting with a particle, typically up to 20° offset from the laser beam's axis, is collected by a photomultiplier tube (PMT) or photodiode and is known as the forward scatter (FSC) channel (Figure. 2). This FSC measurement can give an estimation of a particle's size with larger particles refracting more light than smaller particles. Light measured at a 90° angle to the excitation line is called side scatter (SSC). The SSC can provide information about the relative complexity (for example, granularity and internal structures) of a cell or particle. Both FSC and SSC are unique for every particle and a combination of the two may be used to roughly differentiate cell types in a heterogeneous population such as blood. However, this depends on the sample type and the quality of sample preparation, so fluorescent labeling is generally required to obtain more detailed information.
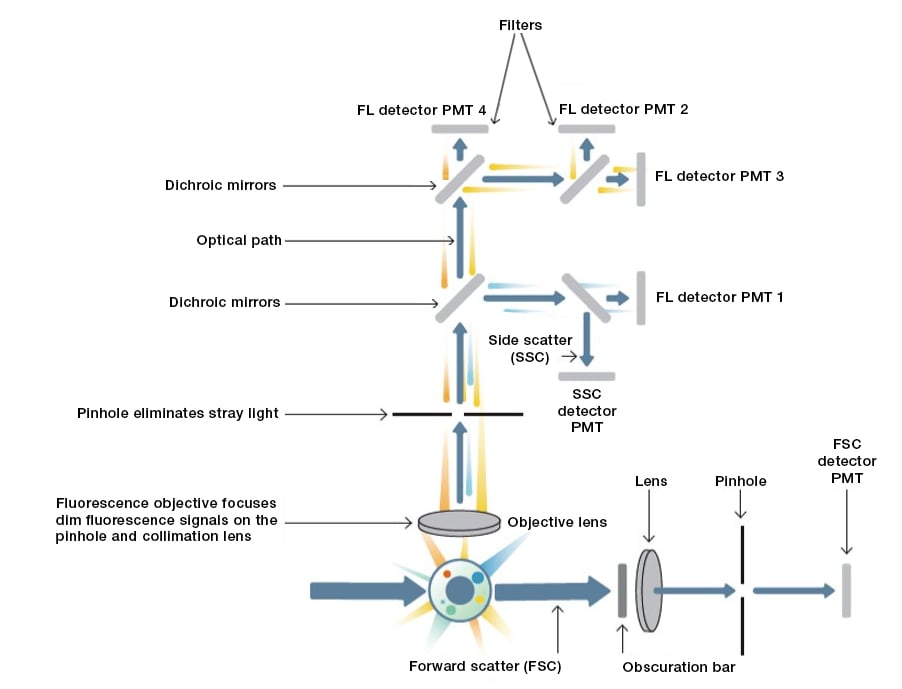
Figure 2. Schematic overview of an example flow cytometer optics setup. FL, fluorescence; PMT, photomultiplier tube; SSC, side scatter; FSC, forward scatter; blue arrow, light path.
Optics & Detection
Fluorescence measurements taken at different wavelengths can provide quantitative and qualitative data about fluorophore-labeled cell surface receptors or intracellular molecules such as DNA and cytokines. Most flow cytometers use separate channels and detectors to detect emitted light, the number of which varies according to the instrument and the manufacturer (Figure 2). Modern instruments tend to use one of several different types of detectors. Photomultiplier tubes (PMTs) are the most commonly used due to their excellent signal-to-noise ratio.
The specificity of detection is controlled by optical filters, which block certain wavelengths while transmitting (passing) others. There are three major filter types. Long pass filters allow light through at wavelengths higher than a cutoff wavelength; short pass filters permit light below a certain wavelength, and band pass filters transmit light within a specified narrow range of wavelengths (termed a band width). Long pass and short pass filters may also be placed at an angle to the oncoming light. In this case, any light that does not pass through the filter can be reflected. When used in this way, the filter is often referred to as a dichroic mirror (Figure 2). This type of filter allows specific wavelengths to pass in the forward direction and reflect light, allowing it to be directed to other filters. The precise choice and order of the filters can be arranged so that multiple signals can be detected simultaneously.
Signal Processing
Once the light generated at the interrogation point is directed by the optics to a detector the electronics system turns that light into an electronic signal. The first step of which is the generation of a signal pulse. These pulses are the result of a stream of photons being converted into current by the detector and reflect the passage of the particle through the laser beam or beams. The magnitude of the current is proportional to the number of photons that hit the detector. As the particle enters the laser beam spot, the current will begin to rise, reaching peak output when the particle is located in the center of the laser beam (Figure 3). At this point, the particle is fully illuminated and will produce a maximum amount of optical signal. As the particle flows out of the laser beam the current output will drop back to baseline. This generation of a pulse is termed an “event”. Most flow cytometers will display data in terms of height, width, and area, describing the properties of the signal pulse
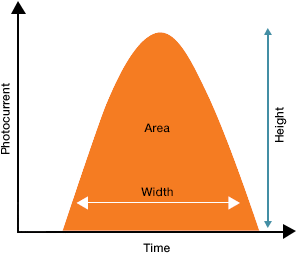
| Height: | The current output at the detector |
| Width: | The time that the cell takes to pass through the laser |
| Area: | The area under the curve |
Figure 3. A visual representation of the signal pulse.
Data Readout
Each signal pulse represents an individual event (or cell). Since thousands of cells are typically measured in each sample, the events must be displayed in a way that makes the data easily interpretable.
The measurement from each detector is referred to as a parameter. Each parameter can be displayed in height, area, and width values using histograms and dot plots in flow cytometry software.
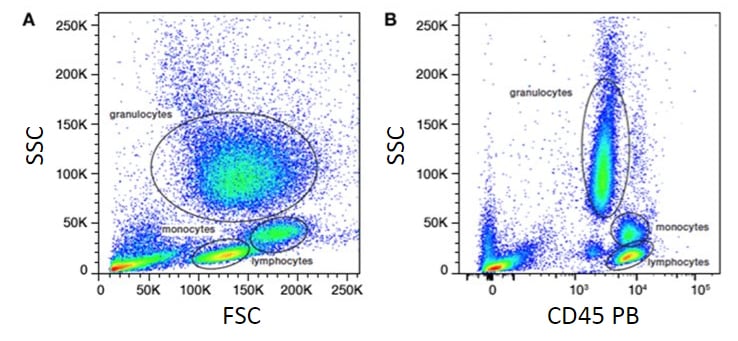
Figure 4. Analysis of lysed whole blood. SSC vs. FSC density plot showing major leukocyte populations (A). SSC vs. CD45 PB fluorescence plot (B). FSC, forward scatter; PB, Pacific Blue; SSC, side scatter.
The Complete Flow Cytometer
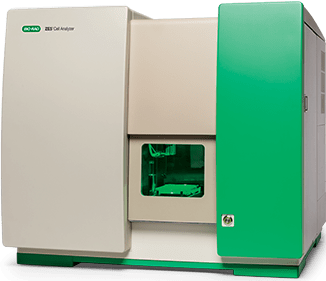
The ZE5 Cell Analyzer has been designed with innovative features and high quality components in every essential element required for flow cytometry.
- Fluidics – maximize sample collection speed and minimize blockages with a bi-directional sample pump, and a high pressure, high speed flow cell
- Optics – powerful 30 parameter, five laser optics using high quality Coherent OBIS lasers and Hamamatsu PMT detectors
- Signal processing – industry leading data acquisition, acquire up to 100,000 events per second with no electronic aborts and all parameters enabled
For more information and to explore the many other innovative features of the ZE5 Cell Analyzer get in touch.
Additional Resources

For anyone just getting started with flow cytometry please visit Flow Cytometry Explained. There you can find a hub of knowledge that includes articles, webinars, tips, guidance, and support as well as resources to aid your experimental set-up, such as our handy Fluorescence Spectraviewer and Multicolor Panel Builder. These are aimed at helping you to get the best data possible from any instrument. We have also developed a comprehensive training course in flow cytometry from first principles to publication that can be accessed free of charge at the Bio-Rad learning academy.