
The Experion Automated Electrophoresis System can be used for protein applications such as protein quality control (monitoring degradation or stability of proteins), general protein or antibody purity analysis, evaluation of protein expression experiments, sample preparation protocol optimization, and analysis of chromatography fractions.The sensitivity of the Experion Pro260 analysis kit is comparable to colloidal Coomassie Brilliant Blue staining of SDS-PAGE gels. The Experion system provides single-step quantitation and size determination (sizing) of protein samples, in addition to nucleic acid analysis. This section provides an overview of the use of the Experion system in various protein applications such as analysis of protein purity, optimization of protein expression conditions, tag removal of purified proteins, and monitoring of chromatography fractions.
Related Topics: Nucleic Acid Analysis Using the Experion System
Page Contents
The Experion Pro260 assay can be used to analyze purity and relative ratios of the light and heavy chains of monoclonal antibodies. Below is an example of data from a study where IgG was separated under reducing conditions. In addition to the electropherogram and virtual gel, a table reporting all detected peaks, relative concentrations, molecular weight, and % Total is displayed.
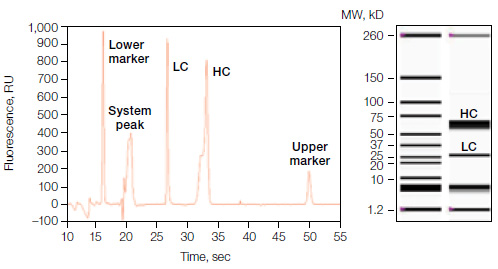
Experion Pro260 analysis showing the electropherogram (left) and virtual gel image (right) of the eluted protein fraction under reducing conditions. Left lane of gel image, Pro260 protein ladder; right lane, mAb-containing fraction.
Another use for the Experion Pro260 assay is in the optimization of protein expression conditions and tag cleavage conditions. Below is an example of data from a study where a 50 kD GST-tagged protein was expressed and induced with IPTG in E. coli. Optimal induction times can be evaluated using the Experion system, which displays the induced target protein along with other background proteins, a virtual gel view, and an electropherogram (electropherogram not shown).
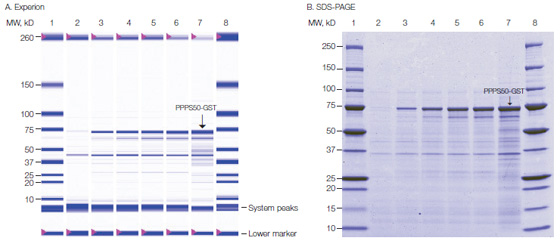
PPPS50-GST expression in E. coli BL21(DE3) cell cultures following induction by IPTG. A, simulated gel image generated by the Experion system showing separation of the Pro260 protein ladder in lanes 1 and 8; B, SDS-PAGE analysis, showing separation of the Precision Plus Protein™ standard in lanes 1 and 8. In both images, lane 2 contains culture sample taken immediately upon IPTG induction; lanes 3–7, culture samples taken 1, 2, 3, 4, and 22 hr after induction by IPTG. The position of the PPPS50-GST fusion protein is indicated.
Tag removal from purified proteins can also be monitored using the Experion system, as shown below with the removal of the GST tag with thrombin.
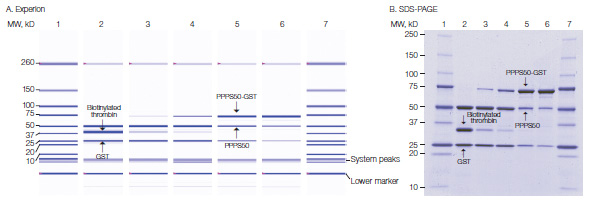
PPPS50-GST cleavage by biotinylated thrombin. A, simulated gel image generated by the Experion system, showing separation of the Pro260 protein ladder in lanes 1 and 7; B, SDS-PAGE analysis, showing separation of the Precision Plus Protein standard in lanes 1 and 7. In both images, lanes 2–6 show the products from cleavage of 64 µg PPPS50-GST by 1, 0.2, 0.1, 0.02, or 0.01 U biotinylated thrombin after incubation at room temperature for 2 hr. The positions of biotinylated thrombin, PPPS50-GST, tag-free PPPS50, and the GST tag are indicated.
Another common protein application for the Experion system is using the Pro 260 assay to monitor chromatography fractions. Checking fractions from chromatography column purifications is an important step when running purifications or when optimizing purification conditions. Using a microfluidic system such as the Experion system enables quick assessment of purity and specific contaminant removal before moving onto another purification step.
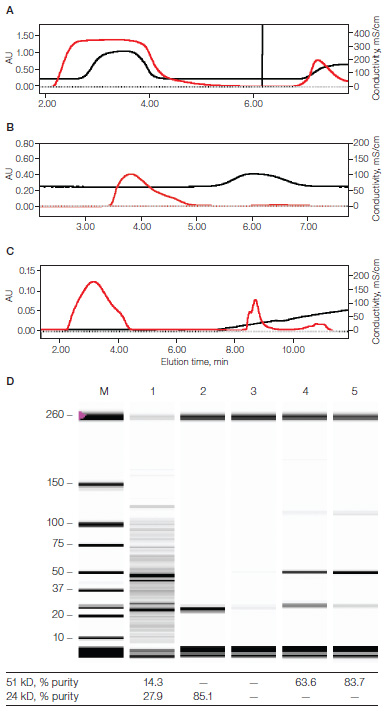
Triple Column Single Instrument Chromatography. A, Affinity chromatography of the protein lysate; B, Desalting chromatography of the affinity purified protein; C, Ion exchange chromatography of purified protein; (—) A280, (—) conductivity; D, Gel electrophoresis analysis of protein fractions. The gel image was generated by the Experion system. M, molecular weight marker; lane 1, protein lysate; lanes 2–5, ion exchange purification with the flowthrough in lane 2 and salt gradient in lanes 3–5. Table below gel image indicates the purity (in %) of each protein in the corresponding fractions.
Videos

The four part training videos presented here provides information on the Experion automated electrophoresis system, helps you refine your chip loading techniques, understand software features and shows an example of a successful RNA run.
- Experion System Overview
- Introduction and Proper Chip Loading
- Experion Software — Run Compare
- Experion RNA Run

This webinar by Field Application Specialist Sean Taylor presents the advanced features of the Experion software for accurately calculating protein concentrations by using customizable internal standard and standard curve calibration samples.