
Proteins in a sample can be analyzed and quantitated after electrophoresis. SDS-polyacrylamide gel electrophoresis (SDS-PAGE), a commonly used technique, can yield information about a protein's size (molecular weight) and yield (quantity). Image analysis software greatly enhances and facilitates these measurements. This section provides some considerations during estimation of molecular weight, and describes relative and absolute quantitation of proteins.
Related Topics: Protein Electrophoresis, Protein Staining, and Western Blotting.
Page Contents
SDS-PAGE is a reliable method for determining the molecular weight (MW) of an unknown protein, since the migration rate of a protein coated with SDS is inversely proportional to the logarithm of its MW. The key to accurate MW determination is selecting separation conditions that produce a linear relationship between log MW and migration within the likely MW range of the unknown protein. See Molecular Weight Estimation Protocol for more information.
To ensure accurate MW determination:
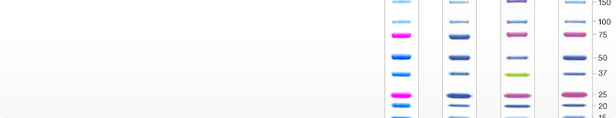
- Separate the protein sample on the same gel with a set of MW standards (see Protein Standards for information regarding selection of protein standards)
- For statistical significance, generate multiple data points (>3 gels)
- Use a sample buffer containing reducing agents (DTT or β-ME) to break disulfide bonds and minimize the effect of tertiary structure on migration
- Include SDS in the sample buffer. SDS denatures secondary, tertiary, and quaternary structures by binding to hydrophobic protein regions, and it confers a net negative charge on the proteins, which results in a constant charge-to-mass ratio; SDS binds proteins in the proportion of 1.4 g SDS/g protein
After separation, determine the relative migration distance (Rf) of the protein standards and of the unknown protein. Rf is defined as the mobility of a protein divided by the mobility of the ion front. Because the ion front can be difficult to locate, mobilities are normalized to the tracking dye that migrates only slightly behind the ion front:
Rf = (distance to band)/(distance to dye front)
Using the values obtained for the protein standards, plot a graph of log MW vs. Rf (see figure below). The plot should be linear for most proteins, provided they are fully denatured and that the gel percentage is appropriate for the MW range of the sample. The standard curve is sigmoid at extreme MW values because at high MW, the sieving effect of the matrix is so large that molecules are unable to penetrate the gel; at low MW, the sieving effect is negligible and proteins migrate almost freely. To determine the MW of the unknown protein band, interpolate the value from this graph.
The accuracy of MW estimation by SDS-PAGE is in the range of 5–10%. Polypeptides like glyco- and lipoproteins are usually not fully coated with SDS and will not behave as expected in SDS-PAGE, leading to inaccurate molecular weight estimations. For more details about protein molecular weight determination using SDS-PAGE, refer to bulletin 3133.
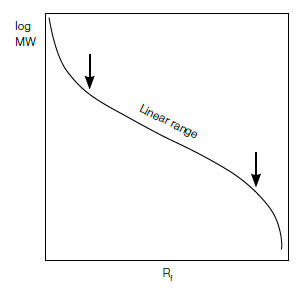
Typical characteristics of a log MW vs. Rf curve for protein standards.
Of all methods available for protein quantitation (including UV spectroscopy at 280 nm, colorimetric dye-based assays, and electrophoresis in combination with image acquisition analysis), only protein quantitation by electrophoresis enables evaluation of purity, yield, or percent recovery of individual proteins in complex sample mixtures.
Two types of quantitation are possible: relative quantitation (quantitation of one protein species relative to the quantity of another) and absolute quantitation (quantitation of a protein by using a calibration curve generated by a range of known concentrations of that protein). Because proteins interact differently with protein stains, staining intensity of different proteins at identical protein loads can be very different, so only relative quantitative values can be determined in most cases. Absolute protein measurements can be made only if the protein under investigation is available in pure form and used as calibrant.
For protein quantitation through SDS-PAGE to be of value:
- Employ sample preparation procedures that avoid protein loss due to insolubility, precipitation, and adsorption to surfaces
- Ensure all proteins enter the electrophoretic separation medium
- Optimize the quality of the electrophoretic separation. Wavy, distorted protein bands and co-migration of bands, for example, lead to questionable results
- When possible, separate a dilution series of pure proteins in parallel. This enables the creation of a calibration curve (as it is done for molecular weight determination with SDS-PAGE, above)
- Analyze all samples (including samples for calibration) at least in duplicate
- Use a stain that offers sufficient sensitivity and a large dynamic range such as Coomassie Blue. For higher sensitivity, fluorescent stains like Flamingo™ and Oriole™ fluorescent gel stains are recommended over silver staining techniques
Videos

This tutorial provides an overview of image acquisition and analysis, including basic and advanced features.
Documents
TEST
| 6210 | Molecular Weight Estimation | Click to download |