
A successful qPCR assay requires efficient and specific amplification of the product. Both the primers and the target sequence can affect amplification efficiency and specificity and thus the accuracy of qPCR assays. Therefore, care must be taken when choosing a target sequence and designing primers. The use of PCR primers specifically designed and validated for qPCR assays with your target of interest is highly recommended. This section provides information and tips on designing qPCR assay primers and probes, choosing a target sequence, multiplexing, selecting reporters and quenchers, and validating and optimizing qPCR assays.
Related Topics: High Resolution Melting, Real-Time PCR Data Analysis, and Real-Time PCR Troubleshooting.
Page Contents
When designing a qPCR assay, follow these steps:
- Check the literature and databases (such as www.rtprimerdb.org) for existing primers
- Choose a target sequence
- Design primers and probes
- Check primer specificity
- Assess primer and probe properties: melting temperature (Tm), secondary structure, and complementarity
- Determine PCR product properties
- Validate the primers and/or probes and optimize the protocol
A number of free online resources are available to help you with primer design (see the Websites tab below). Commercially available programs such as Beacon Designer software can perform both primer design and target sequence selection.
When choosing a region of the target to amplify, follow these guidelines:
- Plan to amplify a 75–200 bp product. Short PCR products are typically amplified with higher efficiency than longer ones, but the PCR product should be at least 75 bp long to easily distinguish it from any primer-dimers that could potentially form
- Avoid regions that have secondary structure, when possible. Use programs such as mfold to predict whether the amplicon will form any secondary structure at the annealing temperature
- Avoid regions with long (>4) repeats of single bases
- Choose a region that has a GC content of 50–60%
When designing primers, follow these guidelines:
- Design primers that have a GC content of 50–60%
- Strive for a Tm between 50 and 65°C. One way to calculate Tm values is by using the nearest-neighbor method. Use this online Tm calculator, with values of 50 mM for salt concentration and 300 nM for oligonucleotide concentration
- Avoid secondary structure; adjust primer locations so they are located outside secondary structure in the target sequence, if required
- Avoid repeats of Gs or Cs longer than 3 bases
- Place Gs and Cs on the ends of the primers
- Check the sequences of forward and reverse primers to ensure no 3' complementarity (avoid primer-dimer formation)
- Verify specificity using tools such as the Basic Local Alignment Search Tool (BLAST))
Primers can be combined with DNA-binding dyes in amplification reactions to monitor the appearance of double-stranded DNA (dsDNA). However, fluorescently labeled probes can be used for greater specificity in a qPCR assay. The most common are hydrolysis probes (see Real-Time PCR Primer and Probe Chemistries for more details).
The Tm of a hydrolysis probe should be 5–10°C higher than that of the primers. In most cases, the probe should be <30 nucleotides nucleotides long. It must not have a G at its 5' end because this could quench the fluorescence signal even after hydrolysis. Choose a sequence within the target that has a GC content of 30–80%, and design the probe to anneal to the strand that has more Gs than Cs (so the probe contains more Cs than Gs).
Currently, it is possible to amplify and quantify as many as five targets in a single qPCR assay, depending on the features of your real-time PCR instrument. Multiplexing confers the following advantages over singleplex reactions:
- Conservation of template DNA, which is important when the amount of starting material is limited
- Reduced numbers of false negatives when a control target is amplified within each sample
- Increased laboratory throughput, reducing the overall cost of qPCR assays
- Less sample handling and associated opportunities for laboratory contamination
Successful multiplexing of qPCR assays requires careful experimental design and optimization of reaction conditions. Simply combining all the primers and templates in the same tube is not sufficient because the amplification of one target many influence the amplification of other targets in the same tube. A common challenge for multiplexed qPCR assays is the amplification of targets present in significantly different concentrations.
Primer and Probe Design
Design all primers to have approximately the same Tm (55–60°C), and also design all probes to have approximately the same Tm (~5–10°C higher than that of the primers). It is important to ensure that the different primer and probe sets do not exhibit complementarity to one another because all primers and probes will be present in one reaction.
Selection of Reporters and Quenchers for Probes
Multiplex qPCR assays require multiple reporters — one to follow each amplification reaction. To distinguish each reaction, choose reporter fluorophores with minimally overlapping emission spectra. The selected fluorophores must also be compatible with the excitation and emission filters of your real-time PCR detection system.
To achieve accurate template quantification in a qPCR assay, each reaction must efficiently amplify a single product, and amplification efficiency must be independent of template concentration and the amplification of other templates. Therefore, you should validate your qPCR assay to verify that these conditions hold.
Determining Reaction Efficiency: Using a Standard Curve
A common method for validating qPCR assays involves the construction of a standard curve, enabling the determination of the efficiency, linear dynamic range, and reproducibility of a qPCR assay. The efficiency of the assay should be 90–105%, the R2 of the standard curve should be >0.980 (or r > –10.990), and the quantification cycle (Cq) values of the replicates should all be similar.
If you are performing a multiplex qPCR assay, you should validate and optimize the individual assays before combining them in the multiplex assay. Note that the range of template concentrations used for the standard curve must encompass the entire range of template concentrations of the test samples to demonstrate that results from the test samples are within the dynamic range of the qPCR assay.
qPCR Assay Specificity Verification: Melt Curve and Gel Analysis
Melt curve analysis can be used to identify different PCR products, including nonspecific products and primer-dimers when the fluorescence of the reporter chemistry depends on the presence of dsDNA, as with SYBR® Green dye. This property is valuable because the presence of secondary nonspecific products and primer-dimers can severely reduce the amplification efficiency and, ultimately, the accuracy of the qPCR assay. Primer-dimers can also limit the dynamic range of the desired standard curve due to competition for reaction components during amplification. After completion of the amplification reaction, a melt curve is generated by increasing the temperature in small increments and monitoring the fluorescence signal at each step. As the dsDNA in the reaction is denatured, the fluorescence decreases rapidly and significantly. A plot of the negative first derivative of the fluorescence versus temperature (–d(RFU)/dT vs. T, the rate of change of fluorescence intensity) displays distinct peaks corresponding to the Tm of each product (Figure 1).
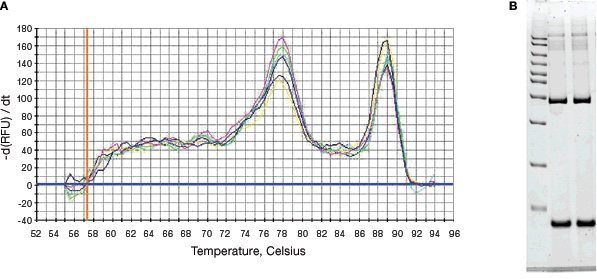
Fig. 1. Melt curve analysis of products from a SYBR® Green assay. A, the negative first derivative of the change in fluorescence plotted as a function of temperature. The two peaks indicate the presence of two PCR products; B, gel analysis of the qPCR products. Lane 1, AmpliSize® 50–20,000 bp molecular ruler; lanes 2 and 3, two replicates of qPCR assay products from the reaction shown in A. The two separate bands in the gel confirm the presence of two PCR products.
The melt peak distinguishes specific products from other products that melt at different temperatures, such as primer-dimers. Because of their small size, primer-dimers usually melt at lower temperatures than the desired product, whereas nonspecific amplification can result in PCR products that melt at temperatures above or below that of the desired product. In the melt curve above, the peak at 89°C represents the target qPCR assay product and corresponds to the upper band in lanes 2 and 3 on the gel. The peak at 78°C represents the nonspecific product and corresponds to the lower band in lanes 2 and 3 on the gel.
Annealing Temperature Optimization
The annealing temperature of a qPCR assay is one of the most critical parameters for reaction specificity. Setting the annealing temperature too low may lead to amplification of nonspecific PCR products. Conversely, setting the annealing temperature too high may reduce the yield of a desired PCR product. Even after calculating the Tm of a primer, you may need to determine the annealing temperature empirically by repeating a reaction at many different temperatures. Similar time-consuming tests may also be required to optimize the denaturation temperature.
The optimal annealing temperature for an assay can easily be determined using qPCR instruments that have a thermal gradient feature. All Bio-Rad real-time PCR detection systems offer a gradient feature. The gradient feature allows you to test a range of temperatures simultaneously, so the annealing temperature can be optimized in a single experiment.
To find the optimal annealing temperature for your qPCR assay, test a range of temperatures above and below the calculated Tm of the primers. The optimal annealing temperature is the one that results in the lowest Cq with no nonspecific amplification. The results of a sample annealing temperature optimization experiment are shown in Figure 2.
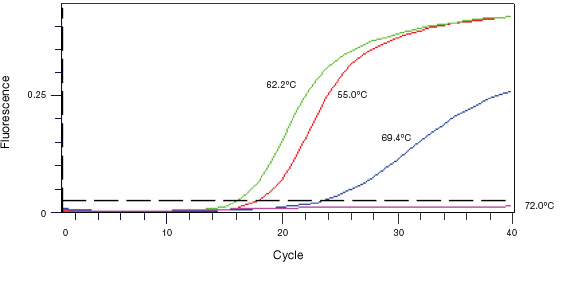
Fig. 2. Annealing temperature optimization. An annealing temperature gradient from 55 to 72°C was performed. The 62.2°C reaction gave the lowest Cq value and was selected as the annealing temperature for this assay.
Because SYBR® Green binds to all dsDNA, it is necessary to check the specificity of your qPCR assay by analyzing the reaction product(s). To do this, use the melt curve function on your real-time instrument and also run products on an agarose gel. Figure 3 shows the melt curve and agarose gel analyses from the annealing temperature optimization experiment shown in Figure 2. The reaction with annealing temperature at 62.2°C is shown. An optimized SYBR® Green qPCR assay should have a single peak in the melt curve, corresponding to the single band on the agarose gel, as shown in Figure 3.
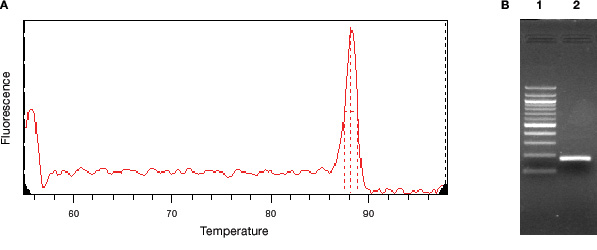
Fig. 3. Verification of SYBR® Green reaction specificity. A, melt curve analysis with a plot of the first derivative of the change in fluorescence intensity as a function of temperature. B, agarose gel analysis of the reaction products. Lane 1, molecular weight markers, 100 – 1,000 bp in 100 bp increments, 1,200 bp, and 1,500 bp. Lane 2, single PCR product corresponding to the peak observed in A.
Multiplex qPCR Assay Validation
To obtain accurate results from a multiplex assay, you must ensure that no target's amplification influences that of another. To determine whether all reactions proceed independently in the multiplex assay, run singleplex and multiplex assays for your targets in the same plate and compare the Cq values. The values obtained for a given target in the singleplex and multiplex assays should not differ significantly. If the Cq values from the singleplex and multiplex reactions are significantly different, you will need to optimize your reactions.
Multiplex qPCR Assay Optimization
If a multiplex reaction is not optimized, the amplification of a more efficient or more abundant target can inhibit that of a less efficient or less abundant target. This occurs because reaction components such as DNA polymerase, dNTPs, and MgCl2 become limiting in later cycles, and the amplification of the less efficient or less abundant target is compromised. Inhibition of a target's amplification will cause its Cq to be delayed in a multiplex qPCR assay relative to that in the singleplex assay. One method for optimizing multiplex reactions involves sequentially increasing the concentrations of DNA polymerase, dNTPs, and MgCl2.
Gudnason H et al. (2007). Comparison of multiple DNA dyes for real-time PCR: Effects of dye concentration and sequence composition on DNA amplification and melting temperature. Nucleic Acids Res 35, e127. PMID: 17897966
Juskowiak B (2011). Nucleic acid-based fluorescent probes and their analytical potential. Anal Bioanal Chem 399, 3157–76. PMID: 21046088
Kubista M et al. (2006). The real-time polymerase chain reaction. Mol Aspects Med 27, 95–125. PMID: 16460794
Wong ML and Medrano JF (2005). Real-time PCR for mRNA quantitation. BioTechniques 39, 75–85. PMID: 16060372
Checking for Existing qPCR Primers
Choosing a Target Sequence
- Entrez Gene (NCBI)
- Ensembl Genome Browser (Sanger Institute/European Bioinformatics Institute)
- Sequence Server (Dolan DNA Learning Center)
Designing Primers and Probes
- Primer3 (Whitehead Institute, MIT)
- Primer-BLAST (NCBI)
- GeneFisher (Bielefeld University)
- FastPCR (PrimerDigital, Helsinki, Finland)
- PerlPrimer (Owen Marshall)
- Primer Design Assistant (Division of Biostatistics and Bioinformatics, NHRI)
- Beacon Designer (Premier Biosoft Intl)*
Designing Primers for Reverse-Transcription PCR (RT-PCR)
Checking Primer Specificity
Assessing Primer and Probe Properties
- OligoAnalyzer (IDT)
- NetPrimer (Premier Biosoft)
- Oligonucleotide Properties Calculator (Northwestern University)
Assessing PCR Product Properties
Selecting Housekeeping Genes and Managing and Automating Analysis of Gene Expression Data
*Indicates commercial software
Videos

This tutorial describes the characteristics of an optimized SYBR® Green I quantitative PCR (qPCR) assay. qPCR assays must be optimized to ensure results that are biologically and statistically significant. Topics include a brief review of qPCR chemistry, with an emphasis on SYBR® Green I reactions, and definitions of the four main characteristics, or hallmarks, of an optimized qPCR assay.

This tutorial describes the characteristics of an optimized SYBR® Green I quantitative PCR (qPCR) assay. qPCR assays must be optimized to ensure results that are biologically and statistically significant. Topics include a brief review of qPCR chemistry, with an emphasis on SYBR® Green I reactions, and definitions of the four main characteristics, or hallmarks, of an optimized qPCR assay.

Presented in Mandarin