
The Bio-Plex assays are built around the well known Luminex xMAP technology using a bead-based flow cytometric platform dedicated to multiplex analysis. Assays are available for many classes of biomolecules and species including cytokines and growth factors, and as specialized disease state panels such as cancer, acute phase immune response, and diabetes markers. Assays are available in several configurations including all-in-one multiplex kits, singleplex sets, and custom kits including premixed options. Commercially available kits are typically developed with optimized protocols. Alternatively, assays may be developed and optimized by an individual lab with the use of antibodies and COOH beads.
Related sections: Detection of Analytes Using the Bio-Plex System and Bio-Plex Assay Data Analysis.
-
FEATURED ARTICLEAberrant Cytokine Activity in the Host Immune
Response to COVID-19 Leads to Cytokine
Release Syndrome
Page Contents
Similar to ELISA, a majority of assays are designed according to a capture sandwich immunoassay format. Briefly, the capture antibody-coupled beads are first incubated with antigen standards or samples for a specific time. The plate is then washed to remove unbound materials, followed by incubation with biotinylated detection antibodies. After washing away the unbound biotinylated antibodies, the beads are incubated with a reporter streptavidin-phycoerythrin conjugate (SA-PE). Following removal of excess SA-PE, the beads are passed through the array reader, which measures the fluorescence of the bound SA-PE (Figure 1).
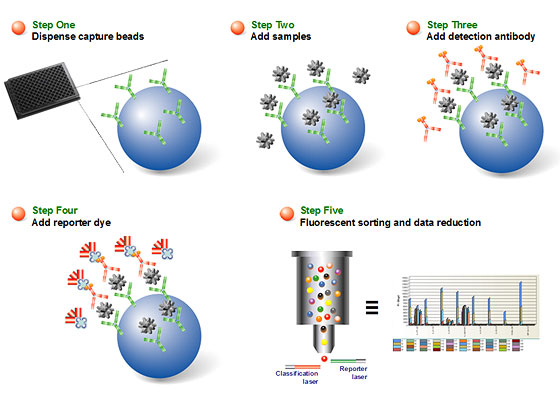
Fig 1. Schematic representation of a immunoassay sandwich-based assay workflow.
The substrate for the antibody sandwich is the bead. Bead characteristics define instrument compatibility and workflow and can be classified into two basic categories, nonmagnetic and magnetic. The nonmagnetic beads are smaller in size (5.6 μ) and are used with the vacuum workflow; they are not compatible with certain instruments that utilize magnets for imaging purposes. Nonmagnetic beads utilize a vacuum workflow requiring filter plates and vacuum filtration to wash the beads. Magnetic beads are coated with magnetite and are therefore larger in size (6.5 μ); they can be used with the magnetic workflow as well as vacuum workflows. These magnetic beads (6.5 μ) are compatible with all currently available life science instruments from any Luminex partner. In the magnetic workflow the beads are washed in the well with dispense and aspiration washing.
xMAP assays may contain nonmagnetic or magnetic beads as substrates. Magnetic COOH beads are the newest core components of xMAP assays. They are unique in that they exhibit both fluorescent and magnetic properties. The beads are stained with a fluorescent dye formulation proprietary to Luminex (Figure 2). The staining process involves swelling the bead particles in a dye containing solvent, which allows the dye molecules to infuse into the coating or the polymer layer. Removal of the solvent in a subsequent step shrinks the beads and traps the dye molecules within the bead particles. The magnetite layer of the bead is one important feature that allows many of the newer assays to be automated with robotic wash stations.
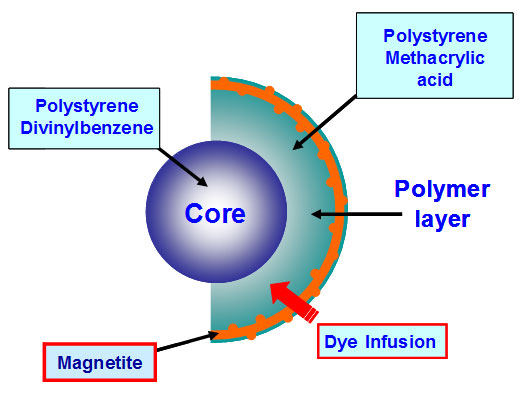
Fig 2. Magnetic bead architecture.
The use of magnetic beads confers a number of benefits, including ease of separation and suitability for automation. Once coated with ligand molecules, the magnetic beads are useful for the capture and separation of a variety of targets. Unwanted sample constituents such as large or fibrous particulates or viscous sample matrix may be washed away following a simple magnetic separation step. Overall, highly efficient magnetic separation eliminates potential interfering molecules, allowing sensitive detection of targets (Figure 3).
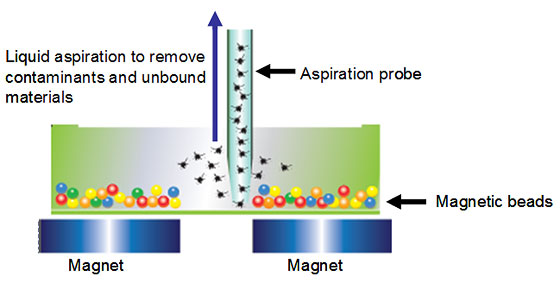
Fig 3. Hands-free washing and separation of magnetic beads.
Assay quality is defined by a series of experiments establishing performance characteristics of the assay, such as accuracy, precision, specificity and sensitivity. Taking into account that an assay should provide reliable results, the concept of assay quality is generally viewed in a broader perspective. Design of the assay workflow, the sample matrices to be tested, and the utility of the test results should also be taken into consideration.
Immunoassay standard curves are inherently nonlinear. As such, a minimum of six non-zero standard points assayed in duplicate is recommended to ensure the robustness of an assay. The concentration-response relationship is most often fitted to a 4- or 5-parameter logistic model.
Specificity — the ability to assess unequivocally a specific analyte in the presence of matrix interfering components.
To investigate antibody-related assay cross-reactivity in multiplexed immunoassays, the following experiments are typically performed:
- Single antigen experiment (evaluates specificity of the capture antibody)
- Single detection experiment (evaluates specificity of the detection antibody, and to some degree the specificity of the capture antibody)
- Antigen exclusion experiment (also an evaluation of specificity of the capture antibody in the presence of all analytes except for its specific target)
Accuracy — the accuracy of an analytical procedure expresses the closeness of agreement between the value that is accepted either as a conventional true value or an accepted reference value. This parameter is frequently used to assess the fit of a curve to the standard points by calculating the ratio of the observed concentration to the expected concentration of each standard point (Figure 4).

Fig 4. Calculation of standard curve recovery.
Assay working range — the range of concentrations within which the assay is precise and accurate. Boundaries of the assay working range are defined by the lower limit of quantitation (LLOQ) and the upper limit of quantitation (ULOQ). The two main parameters dictating these boundaries are intra-assay precision (%CV) and standard curve recovery (Figure 5).

Fig 5. Parameters dictating assay working range.
Precision — the closeness of agreement among a series of measurements obtained from multiple sampling of the same homogenous sample. This parameter is further defined by intra- and inter-assay precision. Intra-assay precision is an expression of within-run repeatability. Inter-assay precision is an expression of plate-to-plate consistency (Figures 5 and 6 shown as %CV).
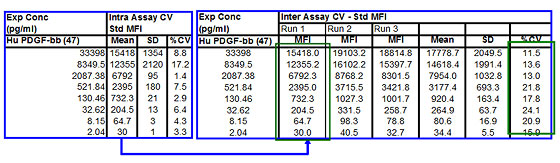
Fig 6. Intra- and inter-assay precision.
Linearity of dilution — Linearity of dilution determines the suitability of a standard curve for reflecting relative quantities of analyte in a complex matrix. In Figure 7 linearity of dilution of prolactin is shown. Linearity of dilution was assessed by spiking a known quantity of recombinant antigen into human serum and plasma matrices. The observed and expected concentrations within the assay working range were plotted. The correlation coefficient (R2) value reflects the linearity of dilution for the assay. Representative results are shown.
 human serum;
  human plasma.
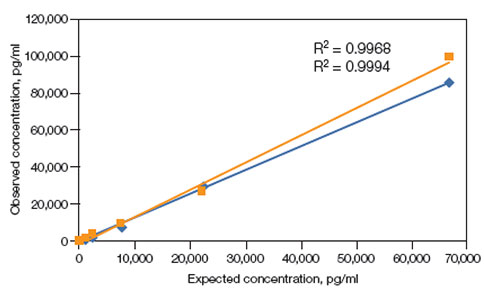
Fig. 7. Linearity of dilution (Bio-Rad Bulletin 6159).
Parallelism – a measure of the impact of matrix effect on an assay in different sample matrices. Parallel standard curves generated in a standard diluent (blue squares) and in a sample matrix (red circles) are compared, and the difference in slope values is used to assess matrix compatibility between the standard curve and the sample matrix (Figure 8).
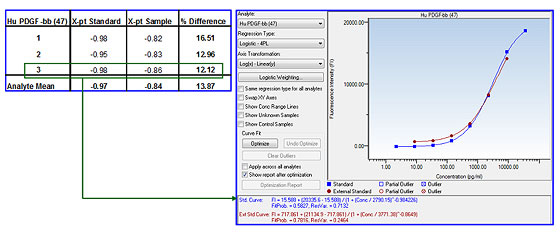
Fig 8. Assay parallelism.
Sensitivity (limit of detection) — the lowest detectable limit of an analyte, but not necessarily quantitative. The value can be defined differently by different assay manufactures. Bio-Rad laboratories defines the value as the concentration of analyte corresponding to the median fluorescent intensity (MFI) of the background (or zero standard) plus two standard deviations (SD) of the mean background MFI. Using the calculated MFI value (y), the corresponding concentration value can be estimated using the logistic-5PL regression shown in Figure 9.
| Target | d | a | c | b | g | d + 2SD(Bkg) | LOD (pg/ml) |
| Hu PDGF-bb (47) | 16.85 | 16815.60 | 3378.25 | -1.03 | 0.94 | 20.00 | 0.48 |
d — estimated response at zero concentration
a — estimated response at infinite concentration
c — midrange concentration at midpoint
b — slope of tangent at midpoint
g — asymmetry factor
x — concentration
y — response
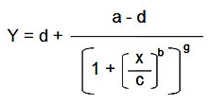
Fig 9. Estimation of assay sensitivity (limit of detection).
Videos


Dr Spinale, Professor of Cardiothoracic Surgery at Medical University of South Carolina, explains how the Bio-Plex system allowed him to tackle important questions in childhood disease research.
