
This section describes the different components of Bio-Rad's real-time PCR system and how they can be utilized to suit your specific needs, and also provides information about the software available for analyzing the data.
Related Topics: qPCR Reagents, Assay Design and Optimization, MIQE and RDML guidelines, qPCR Data Analysis, qPCR Troubleshooting, High Resolution Melt analysis, and Primer and Probes Chemistries.
Page Contents
Real-time PCR detection systems consist of:
- Reaction module — samples are heated and cooled to precise temperatures to promote nucleotide denaturation, annealing, and then polymerase-mediated extension for each round of DNA amplification
- Optical detection system — in the presence of a fluorescent reporter, such as a DNA-binding dye or labeled probe, measurement of the fluorescence intensity of each PCR reaction enables determination of the presence of a target of interest within an experimental sample
- Instrument software — real-time PCR detection systems are typically controlled by an attached computer running specialized software that initiates and monitors runs and then facilitates interpretation of the results. Some instruments, such as the CFX96 Touch and CFX384 Touch Real-Time PCR Detection Systems, include an integrated interface and can be run without a computer. A computer is still needed for data analysis
Temperature Control
- Peltier — this method is employed by most thermal cyclers in use today. It uses a solid-state active heat pump that transfers heat from one side to the other against a temperature gradient with the consumption of electrical energy. One very useful feature of Peltier blocks is that a thermal gradient (Figure 1) can be established, permitting optimization of an assay's annealing step in a single run
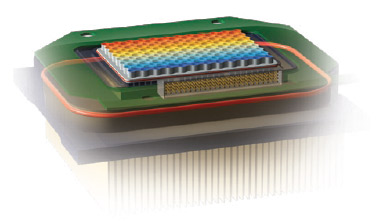
Fig. 1. Thermal gradient of the CFX96 Touch reaction block. The highest temperature is at the top and the lowest at the bottom. - Heated and cooled air — this type of instrument uses a chamber in which tubes are suspended and air of a defined temperature is circulated for specified periods of time as required for PCR
Formats
Reaction blocks come in multiple formats with the most common being a 96-well block (Figure 2) with reaction volumes ranging from 1 to 125 µl. Blocks with more than 384 wells typically use microfluidics with volumes in the pico to nanoliter range.
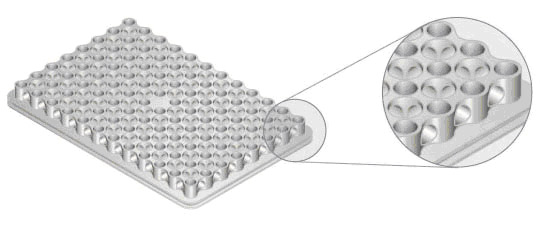
Fig. 2. Close-up view of the CFX96 Touch reaction block. This reduced-mass sample block produces fast ramping and settling, quickly reaching target temperatures.
There are a wide variety of optics systems that use a combination of light sources, filters, and detectors to measure the amount of fluorescence that is present in real-time PCR reactions.
Light Sources
- Light-emitting diodes (LEDs) — there can be individual or multiple LEDs present in a shuttle mechanism, which is positioned above each well so that each one is independently illuminated (Figure 3), or these can be arranged in a stationary array that excites multiple wells at a time (Figure 4)
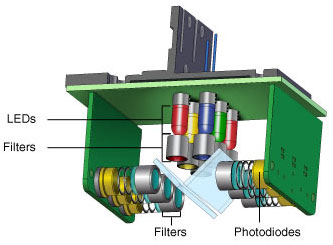
Fig. 3. CFX96 Touch optics shuttle. Six filtered LEDs and six filtered photodiodes are used for excitation and detection. Light is filtered in a narrow bandwidth, ensuring that only data from the desired fluorophores are collected.
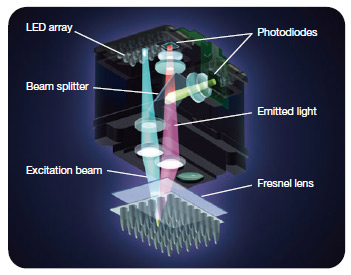
Fig.4. MiniOpticon™ real-time PCR detection system optics. Forty-eight LEDs fire in rapid succession, illuminating a single sample at a time, while a Fresnel lens focuses each beam directly down into the center of the corresponding well, minimizing light loss. Emitted fluorescence is split into two beams that pass through separate filters to two sensitive photodiodes. - Halogen lamp — this light source emits broad-spectrum white light, which is then filtered to excite specific fluorophores (Figure 5)
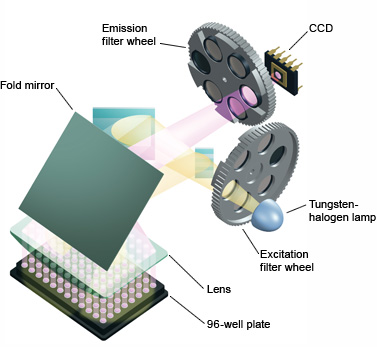
Fig.5. iQ™5 real-time PCR detection system optics. All 96 wells are excited by a combination of narrow-bandpass filters and a tungsten-halogen lamp. Filtered light from the lamp is reflected off mirrors, passes through a condensing lens, and is focused into the center of each well. Fluorescent light emitted from the wells reflects off the main fold mirror, passes through an emission filter, and is detected by a 12-bit charge-coupled device (CCD). - Laser — this emits high-intensity light, but of a narrow bandwidth, confining its use to collecting data from a small set of fluorophores, limiting its use in multiplexing
Detectors
Light from excited fluorophores can be detected by a stationary device (Figure 4) or from a movable one (Figure 3). There are several types of detectors that are used in real-time PCR instruments.
- A photodiode (Figures 3 and 4) is a type of photodetector that, when exposed to light, causes a current to flow. These have a wide spectral range, are rugged, with low failure rates, and can be quite compact in size
- A CCD (Figure 5) converts the light that it captures into digital data. The quality of the image captured is determined by the resolution (measured in megapixels). CCDs are typically used to capture an image of the reaction plate, whose content is then interpreted by instrument software
- A photomultiplier tube (PMT; Figure 6) multiplies the current that is produced by incident light
Fig. 6. DNA Engine Opticon® 2 real-time PCR detection system optics. The light path from the LED array to the PMT is shown.
Real-time instrument software consists of the following major components:
- Protocol setup
- Plate setup
- Data collection
- Data analysis
Protocol setup: the denaturation, annealing, and extension parameters, the number of repeated cycles, and the steps at which data are to be collected are specified (Figure 7).
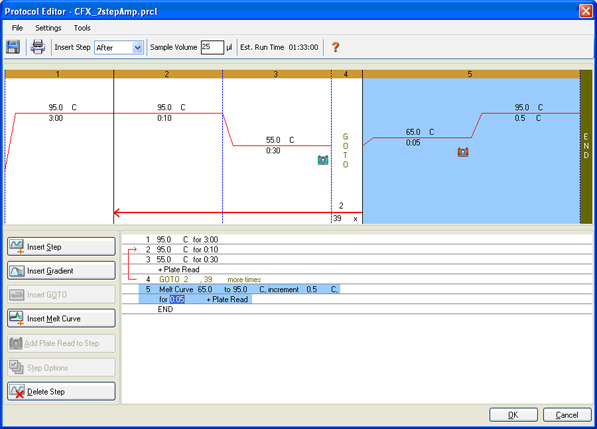
Fig. 7. Protocol Editor window in CFX Manager Software. This protocol consists of amplification followed by a melt curve to verify that a specific product has been produced.
Plate setup: The contents of each well are identified so that data can be properly analyzed once collected (Figure 8). The scan mode, which designates what channels are to be read, is also indicated.
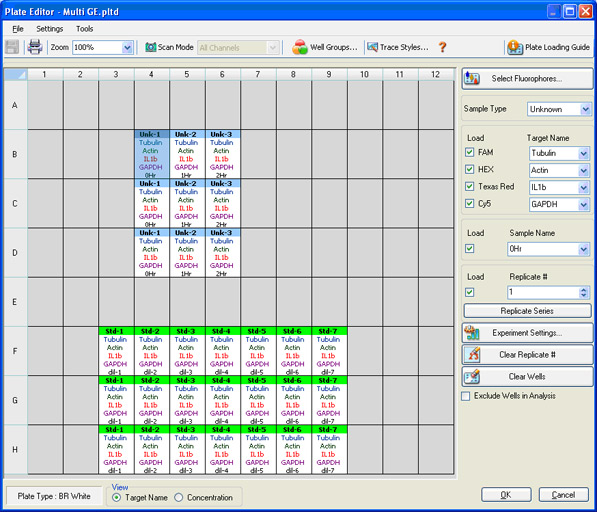
Fig. 8. CFX96 Touch Plate Editor screen in CFX Manager software. In this screen, four different fluorophores are selected, and the sample type, sample name, and target name are indicated.
Data collection: The fluorescence intensity of the reaction mixture in each well is measured and plotted versus the reaction cycle. If a target of interest is present, its amplification can be monitored in real time (Figure 9).
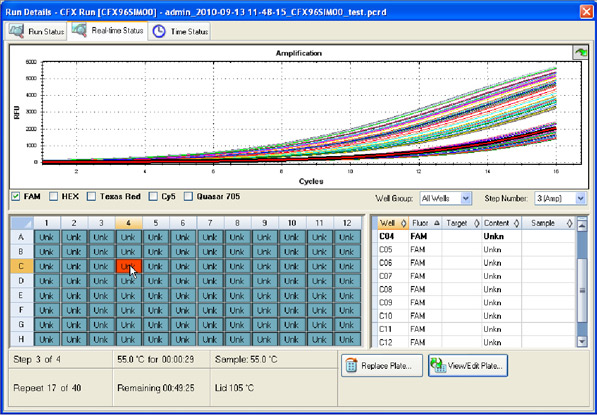
Fig. 9. Run Details window in CFX Manager software. The intensity of FAM fluorescence for all wells of a 96-well plate is shown up to cycle 16.
Data analysis: Once a run is complete, a baseline is automatically calculated or can be manually set and applied to each sample so that the values obtained from different wells can be compared. A quantification cycle (Cq) is then determined for each well based on the position of a single threshold line (Figure 10) or by regression analysis.
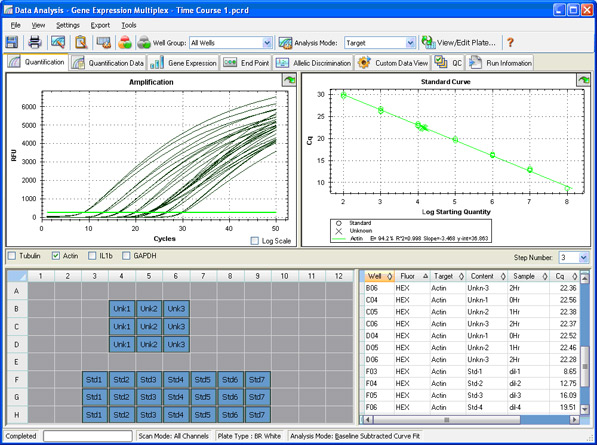
Fig. 10. Quantification window in CFX Manager software.
Two types of analyses that are commonly performed in real-time PCR are absolute and relative quantification. Absolute quantification is achieved by comparing the Cq values of test samples to a standard curve. The result of the analysis is quantity of nucleic acid (copy number, µg) per given amount of sample (per cell, per µg of total RNA). In relative quantification, the analysis result is a ratio: the relative amount (fold difference) of a target nucleic acid for equivalent amounts of test and control sample A vs. B (Figure 11; see Real-Time PCR Experimental Design and Data Analysis for more information).
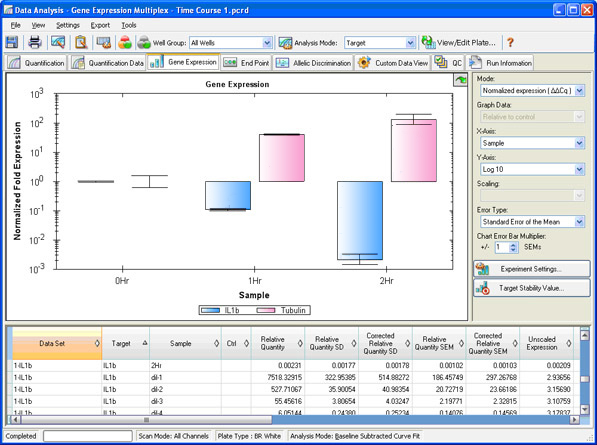
Fig. 11. Gene expression window in CFX Manager software. The normalized fold expression of three samples is shown for two targets of interest.